The U.S. labor market has crossed a threshold that has historically made investors nervous: payroll growth has turned negative. But the signal coming from July’s employment report looks very different from the job losses that accompanied previous recessions—and that distinction may explain why stocks rallied rather than sold off.
U.S. nonfarm payrolls fell by 23,000 in July, compared with expectations for an 80,000 increase, while May and June were revised down by a combined 103,000 jobs. Three-month average job growth has slowed to just 20,000 per month. Yet the unemployment rate declined to 4.1% from 4.2%, largely because another 264,000 people left the labor force, pushing labor-force participation down to 61.4%, its lowest level since early 2021.
That combination—negative payroll growth without rising unemployment—is the first clue that the current episode may not fit the traditional recession template.
Historically, Negative Payrolls Are a Serious Warning
In the modern U.S. economy, outright monthly job losses have tended to cluster around recessions. An analysis of 115 historical negative payroll months finds that sustained sequences of job losses have been particularly associated with economic contractions. Isolated negative months can occur because of strikes, weather or other disruptions, but repeated negative readings historically have been much more ominous.
The market relationship, however, is more complicated.
Employment is generally a coincident-to-lagging economic indicator, while stocks anticipate future economic conditions. J.P. Morgan’s historical work shows that the stock market typically bottoms before unemployment reaches its cyclical peak. The Richmond Fed similarly notes that unemployment frequently continues rising even after recessions have ended.
That helps explain why a negative jobs report is not automatically a sell signal. By the time businesses begin cutting employees aggressively, equity investors often have already discounted weaker growth. Fidelity calculates that the S&P 500 actually generated positive returns during five of the 11 U.S. recessions since 1950, and stocks have historically rebounded well before economic headlines turned favorable.
What normally matters is not a single negative payroll number. It is whether job losses become self-reinforcing: layoffs rise, unemployment accelerates, consumer spending weakens, earnings estimates fall and companies respond with additional layoffs.
So far, that chain reaction is missing.
The Biggest Difference: America Needs Far Fewer New Jobs
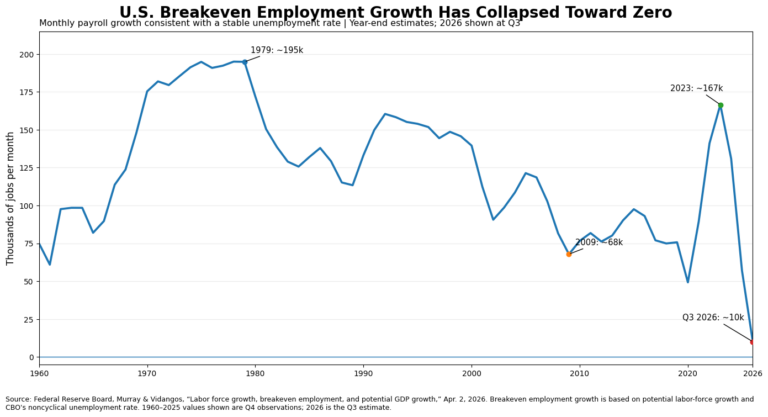
Perhaps the most important difference in 2026 is that the economy no longer needs anything close to the 150,000-200,000 monthly jobs investors once associated with a healthy labor market.
Federal Reserve staff estimated in April that slowing population growth and sharply reduced immigration could push the breakeven rate of employment growth to fewer than 10,000 jobs per month in 2026. During 2023-24, by comparison, breakeven employment growth was estimated around 155,000 per month.
The implication is striking. Fed researchers concluded that with labor-force growth near zero, negative monthly payroll prints can occur even while the economy is growing at its potential rate. Because monthly payroll estimates are noisy, their calculations suggested job losses approaching 100,000 in an individual month would not necessarily be inconsistent with continued economic expansion.
In other words, the economic meaning of “zero payroll growth” has changed.
Immigration restrictions, retirements and an aging population are constraining labor supply at the same time employers are becoming more cautious about hiring. The labor force has fallen by more than one million people this year, according to the July employment report.
Where Are the Layoffs?
The second major difference is that companies are not firing workers aggressively.
Initial unemployment claims fell to 206,000 in the week ended August 15 and remain near the bottom of their 189,000-230,000 range for 2026. Continued claims stood at 1.799 million, also relatively subdued.
June’s JOLTS data tell a similar story. Employers reported 1.766 million layoffs and discharges, leaving the layoff rate unchanged at just 1.1%. Hiring is weak, but firing remains weak as well—the “slow-hire, slow-fire” labor market economists have been describing for much of the past year.
July’s headline decline was also distorted by its composition. Government payrolls fell 53,000, including almost 50,000 jobs in local government education. Private employers still added 30,000 positions. Construction added 22,000 and healthcare added 22,000, while leisure and hospitality and retail produced most of the private-sector weakness.
There has already been precedent for this pattern. February payrolls eventually were revised to a decline of 133,000, partly because of strike activity, before employment rebounded by 178,000 in March.
Productivity Is Allowing Growth Without Much Hiring
Another structural change is that output is becoming less dependent on adding workers.
Second-quarter nonfarm productivity increased at a 1.4% annualized rate and 2.2% from a year earlier, while output grew 1.7% and hours worked increased just 0.3%. Since late 2019, productivity has risen at a 2.1% annualized rate even though hours worked have expanded only 0.4% annually.
That matters because an economy generating more output from each hour worked simply does not require the same employment growth to generate GDP growth.
And the latest business surveys are hardly signaling recession. S&P Global’s August Composite PMI jumped to 56.0, its strongest reading since April 2022, while services PMI reached 56.8. S&P Global said the surveys were consistent with third-quarter GDP growth approaching a 3% annualized pace, and service-sector hiring accelerated to its fastest rate in 19 months.
Negative payrolls alongside accelerating business activity would be highly unusual in a conventional recession.
Why Wall Street Cheered Bad Jobs News
The market’s reaction to the July jobs report makes the difference especially clear.
On August 7, the S&P 500 rose 0.62% to a record high and the Nasdaq gained 1.30% after the negative payroll number. Expectations for a September Federal Reserve rate increase fell to roughly 44%, from 55% the previous day and 67% a week earlier.
Investors effectively interpreted the report through the interest-rate channel rather than the recession channel. Historically, sustained job losses were often accompanied by accelerating unemployment, rising layoffs and deteriorating corporate profits. Today, investors see softer hiring as potentially reducing the Fed’s need to tighten monetary policy while corporate earnings and economic output remain relatively resilient. For now, that creates a narrow “bad news is good news” window.
The indicators investors should watch are therefore claims and layoffs rather than payrolls alone. If initial claims begin rising persistently, unemployment reverses higher, private payrolls contract broadly and PMI surveys slide toward 50, the interpretation would change materially. Weak employment would no longer represent a shrinking labor supply and greater productivity; it would increasingly signal falling labor demand. That is the distinction separating today’s negative payroll print from the classic recession pattern. The labor market is unquestionably cooling. But in 2026, zero job growth is no longer the economic dividing line it once was. The more consequential question is whether companies begin firing workers they already have. So far, they haven’t.
Sources
- Federal Reserve Board — “Labor Force Growth, Breakeven Employment, and Potential GDP Growth,” April 2, 2026. This is the primary source for the long-term breakeven employment-growth analysis and chart. Federal Reserve FEDS Note
- Bureau of Labor Statistics — July 2026 Employment Situation. Payrolls declined 23,000, unemployment was 4.1%, and May/June payrolls were revised down by 103,000 combined. BLS Employment Situation
- U.S. Department of Labor — Weekly Unemployment Claims, August 20. Initial claims were just 206,000, supporting the argument that the labor slowdown has not yet become a broad layoff cycle.
- BLS — June 2026 JOLTS. Job openings were 7.4 million, hires 5.3 million and layoffs/discharges approximately 1.8 million—consistent with a low-hire, low-fire labor market.
- BLS — Q2 2026 Productivity and Costs. Productivity rose 1.4% annualized and 2.2% year over year, while hours worked increased only 0.3%, illustrating how output can expand without rapid hiring.
- S&P Global — August Flash U.S. PMI. Composite PMI rose to 56.0 and employment increased at its fastest pace since early 2025, providing an important counterpoint to the weak payroll report.
- J.P. Morgan Asset Management — Market Inflection Points, Recessions and Unemployment. Useful historical context showing that equities generally bottom before unemployment reaches its cyclical peak.
- Reuters — July Jobs Report / Market Reaction, August 7. Covers the negative payroll surprise, shrinking labor force, Fed repricing and the equity-market rally following the report.