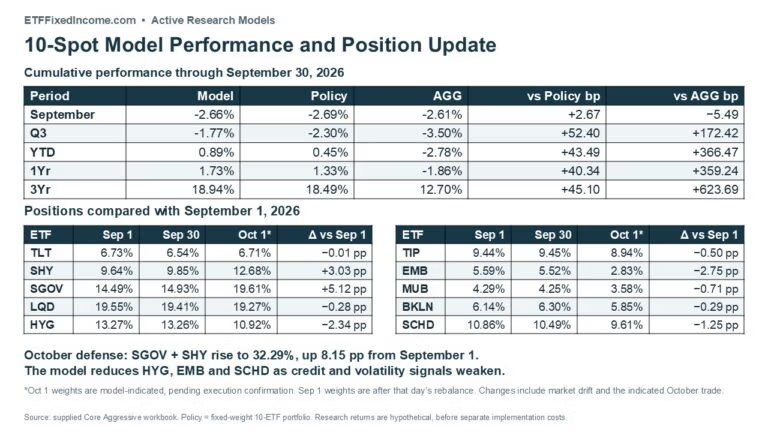
September absolute and excess returns
The ETFFixedIncome.com 10-Spot Active Research Model returned −2.66% in September, compared with −2.69% for its policy benchmark, producing 2.67 basis points of excess return. AGG returned −2.61%. Active positioning provided a small cushion during a difficult month for fixed income, but did not prevent a loss. The model trailed the broad bond-market reference, AGG, by 5.49 basis points.
The primary benchmark is the model’s fixed-weight 10-ETF policy portfolio. The report also compares the strategy with AGG, the iShares Core U.S. Aggregate Bond ETF. Excess return is the model’s cumulative return less the relevant benchmark’s return. Performance versus policy isolates active allocation; performance versus AGG also reflects structural differences in credit, cash, loan and dividend-equity exposure.
| Period | Model return | Policy return | AGG return | vs Policy bp | vs AGG bp |
| September | -2.66% | -2.69% | -2.61% | +2.67 | −5.49 |
| Q3 | -1.77% | -2.30% | -3.50% | +52.40 | +172.42 |
| YTD | 0.89% | 0.45% | -2.78% | +43.49 | +366.47 |
| 1Yr | 1.73% | 1.33% | -1.86% | +40.34 | +359.24 |
| 3Yr | 18.94% | 18.49% | 12.70% | +45.10 | +623.69 |
Cumulative total returns through September 30, 2026. September and Q3 are calendar periods; one year and three years end on September 30. Positive excess return indicates outperformance. Model results are hypothetical research results before separate implementation and advisory costs.
Strategy level attribution summary
September’s 2.67-basis-point active gain came from reduced long-duration and municipal exposure, largely offset by retained high-yield, emerging-market debt and dividend-equity overweights. The result supports a measured assessment: the allocation process helped at the margin, while the portfolio remained exposed to the broad repricing of rates and risk.
For Q3, the model declined 1.77%, versus 2.30% for policy and 3.50% for AGG. Its 172.42-basis-point advantage over AGG comprised 52.40 basis points from active allocation and 120.01 from the policy mix. Year to date, the model gained 0.89%, versus 0.45% for policy and −2.78% for AGG; the 366.47-basis-point advantage over AGG comprised 43.49 from active allocation and 322.98 from the policy mix.
Over one year, the model returned 1.73%, versus 1.33% for policy and −1.86% for AGG, outperforming by 40.34 and 359.24 basis points, respectively. Over three years, it returned 18.94%, versus 18.49% and 12.70%, adding 45.10 basis points versus policy and 623.69 versus AGG. Three-year annualized returns were 5.95% for the model, 5.82% for policy and 4.07% for AGG. Active allocation added modest value; the policy mix explains most of the advantage over AGG.
The October response is a shift toward liquidity: the indicated combined allocation to Treasury bills and short Treasuries rises from 24.79% to 32.29%. The following sections explain the positions, market outlook and signal changes, followed by detailed attribution for all five periods.
October position update
The September 30 workbook explicitly flags a trade for the next monthly session. The October 1 weights below are the indicated post-rebalance allocations, calculated as a 50% move from September-end holdings toward the new targets. They are model instructions, not confirmation of an executed account trade.
| ETF and exposure | Policy | Sep 30 held | Oct 1 indicated | Change pp |
| TLT Long Treasury | 8.00% | 6.54% | 6.71% | +0.17 |
| SHY Short Treasury | 10.00% | 9.85% | 12.68% | +2.82 |
| SGOV Treasury bills | 15.00% | 14.93% | 19.61% | +4.68 |
| LQD IG corporate | 20.00% | 19.41% | 19.27% | −0.14 |
| HYG High yield | 12.00% | 13.26% | 10.92% | −2.34 |
| TIP TIPS | 10.00% | 9.45% | 8.94% | −0.51 |
| EMB EM dollar debt | 5.00% | 5.52% | 2.83% | −2.69 |
| MUB Municipals | 5.00% | 4.25% | 3.58% | −0.67 |
| BKLN Senior loans | 5.00% | 6.30% | 5.85% | −0.45 |
| SCHD Dividend equity | 10.00% | 10.49% | 9.61% | −0.88 |
SGOV rises 4.68 percentage points and SHY 2.82 points. EMB falls 2.69 points, HYG 2.34 points and SCHD 0.88 point. LQD remains the largest bond allocation at 19.27%, while BKLN retains a modest overweight at 5.85% versus its 5% policy weight. These positions preserve income exposure while reducing dependence on spread compression and equity strength.
TLT rises slightly to 6.71%, but remains below its 8% policy allocation. That small increase reflects the interaction of the defensive factor with other signals and portfolio normalization; the duration score is still firmly negative. The defensive rotation is concentrated in bills and short Treasuries rather than a broad extension of interest-rate risk.
Benchmark note: the primary comparator is the workbook’s fixed-weight 10-ETF policy portfolio shown above. AGG is a secondary broad bond-market reference. SCHD is a dividend-equity ETF; its exposure makes this an income-oriented multi-asset model rather than a pure bond portfolio.
September fixed income market recap
September penalized both duration and credit risk. In the supplied market series, the two-year Treasury yield rose 53 basis points to 4.87%, the 10-year rose 53 basis points to 5.27%, and the 30-year rose 38 basis points to 5.62%. The 10-year real yield climbed from 2.44% to 2.93%, while the 10-year breakeven increased only 5 basis points to 2.36%. The much larger real-yield move helps explain why inflation-protected bonds also lost ground; inflation protection does not eliminate duration risk.
The Federal Reserve raised its target range by 25 basis points to 3.75%–4.00% on September 16, citing elevated inflation alongside resilient domestic spending and strong capital investment. August CPI rose 0.4% month over month and 3.4% year over year. The September 30 PCE release put headline inflation at 3.4% and core inflation at 3.0%, with monthly gains of 0.3% and 0.2%, respectively. These releases left little basis for treating higher yields as a temporary dislocation. [2–4]
Credit offered limited shelter. High-yield spreads widened from 265 basis points on September 1 to 312 at month-end, while investment-grade spreads moved from 81 to 84 basis points. These comparisons use September 1 because the workbook lacks August 31 spread readings. MOVE rose from 75.32 at August-end to 110.46, reinforcing the model’s defensive response.
ETF returns reflected the same hierarchy. SGOV gained 0.30%, while BKLN slipped only 0.13%. TLT declined 5.38%, LQD 3.39%, EMB 3.72% and MUB 3.54%; TIP fell 2.60%. SCHD’s 6.02% decline added an equity-income headwind. AGG returned −2.61%. Income accrual cushioned some exposures, but could not absorb September’s repricing of rates and risk premiums.
October outlook
Our October preference is to collect income with less duration and credit exposure while waiting for evidence that the rise in real yields and volatility is stabilizing. The model’s larger SGOV and SHY allocations are consistent with that view. Higher starting yields improve prospective income, but they do not establish that bond prices have bottomed.
Inflation and household demand remain the central tension. August real consumption increased 0.6%, even as real disposable income was unchanged and the saving rate stood at 4.1%. Spending resilience reduces the urgency for monetary relief; the income constraint raises the risk of weaker consumption later. Energy and tariff-related price pressures should be monitored as potential obstacles to disinflation rather than assumed to translate into a successful TIPS trade. [4]
A sustained decline in real yields and MOVE, together with improving Treasury momentum, would support rebuilding duration. Stabilizing credit spreads and stronger market breadth would argue for retaining more HYG, EMB and dividend equities. Conversely, further spread widening alongside elevated volatility would reinforce the present preference for liquidity. A rapid bond rally is the principal opportunity cost of the defensive shift.
October’s scheduled checkpoints include the employment report on October 2, CPI on October 14 and the FOMC meeting on October 27–28. The model reviews trading monthly, so improving or deteriorating daily readings do not automatically create an intramonth trade. [3,5,6]
Indicator and signal recap
September’s signal deterioration was broad enough to change the model’s preferred regime to Defensive cash on September 24. By month-end, credit had turned negative, duration and inflation-hedge scores remained at their lower bounds, and the defensive score had reached its upper bound. Confidence rose from 54.82% at August-end to 80.08%. This is the model’s signal-strength measure, not a probability of a profitable trade.
| Factor score | Aug 31 | Sep 30 | Change |
| Credit | +0.08 | -0.64 | -0.72 |
| Duration | -1.00 | -1.00 | +0.00 |
| Inflation hedge | -1.00 | -1.00 | +0.00 |
| Defensive | +0.02 | +1.00 | +0.98 |
| Equity breadth | +0.20 | +0.05 | -0.15 |
| Floating rate | +0.15 | -0.11 | -0.27 |
| Emerging markets | +0.06 | -0.39 | -0.45 |
| Municipals | -0.40 | -0.65 | -0.26 |
| Dividend equity | -0.07 | -0.17 | -0.10 |
Scores range from −1 to +1; higher values favor the named exposure. The August 31 credit comparison is affected by missing spread inputs, which the workbook treats as neutral. Scores above are the unscaled indicator readings; confirmation and overlay settings are applied separately.
Credit weakened from +0.08 to −0.64 as spreads and volatility rose. For a comparison with populated spread inputs, the September 1 credit score was +0.38. The 63-session changes at month-end were +38 basis points for high-yield spreads and +8 for investment-grade spreads. The 21-session average advancing-minus-declining equity volume balance fell from +4.26 to −9.57 percentage points, weakening the participation signal despite a positive six-month S&P 500 trend.
Duration stayed at −1.00 as the 10-year yield rose approximately 80 basis points over 63 sessions and the real yield rose 68 basis points. Duration confirmation remained at its 25% floor. The inflation score also stayed at −1.00: it measures the attractiveness of inflation-sensitive exposures, not the inflation rate itself. Rising real yields and weak TIP momentum outweighed the higher breakeven reading.
The month-end overlay scale is 100%, reflecting the defensive regime. Credit confirmation is 77.5%, duration confirmation 25% and inflation confirmation 40%. Those confirmation readings do not overturn negative factor scores. The effective inflation overlay is only 20%, after applying the 50% medium-conviction cap to the 40% confirmation scale.
Why September holdings changed only once
The September 1 trade used August 31 signals: Balanced income, zero active overlay and policy-weight targets. The proposed one-way target difference was 7.71%, above the 1.50% threshold, and confidence exceeded the 35% minimum. The 50% partial-rebalance rule generated 3.85% one-way turnover, reducing inherited HYG, EMB, BKLN and SCHD overweights while restoring some TLT, TIP and municipal exposure.
No further trades occurred in September because execution is gated by the monthly review schedule. The dashboard’s September 30 “Hold” describes that day; the forward trade flag is true. For October 1, the target gap is 15.35%, implying 7.67% one-way turnover at the 50% rebalance fraction. The 63-session maximum-hold provision was not needed to trigger this change.
Performance attribution versus the benchmark
The table attributes the model’s return difference versus its fixed-weight policy portfolio to ETF allocation decisions. Positive values indicate an active contribution; negative values indicate a drag. Daily effects are linked across each period so the total reconciles to the compounded model return minus the compounded policy return.
| Contribution bp | Sep | Q3 | YTD | 1Yr | 3Yr |
| TLT | +7.06 | +27.34 | +13.59 | +9.26 | −81.45 |
| SHY | +0.18 | −0.11 | −0.40 | −3.30 | −24.42 |
| SGOV | −0.11 | −1.00 | −3.13 | −7.98 | −51.38 |
| LQD | +1.55 | +4.14 | +1.96 | +1.83 | −13.55 |
| HYG | −3.40 | −2.00 | −2.08 | −0.36 | +81.86 |
| TIP | +1.42 | +2.81 | +2.44 | +3.20 | −25.08 |
| EMB | −2.14 | −5.02 | −7.55 | +0.75 | +55.47 |
| MUB | +2.60 | +7.23 | +2.72 | +4.47 | −17.20 |
| BKLN | −0.19 | +5.67 | +3.86 | +2.55 | +43.20 |
| SCHD | −4.30 | +13.35 | +32.07 | +29.92 | +77.65 |
| Model minus policy | +2.67 | +52.40 | +43.49 | +40.34 | +45.10 |
| Policy minus AGG | −8.16 | +120.01 | +322.98 | +318.90 | +578.59 |
| Model minus AGG | −5.49 | +172.42 | +366.47 | +359.24 | +623.69 |
Basis points of cumulative return difference; 100 basis points equal 1 percentage point. Totals use unrounded values. The policy-minus-AGG row is a portfolio-level benchmark bridge, not ETF-level attribution against AGG.
What the attribution says
September’s duration underweight worked, but its benefit was largely consumed by retained risk exposure. TLT positioning added 7.06 basis points, while SCHD, HYG and EMB together subtracted 9.84. The October reduction in those three risk sleeves responds to that deterioration; the upcoming trade addresses risks that remained in September’s held portfolio.
Across Q3, active allocation made a more meaningful difference. The model’s 172.42-basis-point advantage over AGG consisted of 52.40 basis points from active decisions relative to policy and 120.01 basis points from the policy mix itself. Year to date, the equivalent split was 43.49 and 322.98 basis points. This distinction matters when evaluating whether the model’s results arise from tactical decisions or from owning a different set of risks.
Over three years, credit and equity-income allocations delivered most of the positive active contribution. HYG added 81.86 basis points, SCHD 77.65, EMB 55.47 and BKLN 43.20. TLT detracted 81.45 basis points and SGOV 51.38. The longer record supports a measured conclusion: the model captured benefits from credit and equity participation, while defensive allocation choices also imposed opportunity costs.
Attribution method
Daily active contribution is the ETF’s beginning model weight less its policy weight, multiplied by that day’s total return. Carino logarithmic linking adjusts those daily effects to reconcile exactly with each period’s compounded return difference. This is allocation attribution within the same ETF universe; it does not isolate issuer selection, yield-curve, spread, currency or security-level effects. AGG attribution is limited to the portfolio-level bridge shown above.
Contributions to total model return
These are absolute contributions to model performance, in percentage points. They answer which holdings generated gains or losses, independently of whether their weights were above or below policy. Each column sums to the model’s cumulative return.
| Contribution pp | Sep | Q3 | YTD | 1Yr | 3Yr |
| TLT | −0.36 | −0.46 | −0.53 | −0.65 | −0.74 |
| SHY | −0.05 | −0.02 | +0.03 | +0.11 | +1.04 |
| SGOV | +0.04 | +0.13 | +0.38 | +0.48 | +1.76 |
| LQD | −0.66 | −1.02 | −0.88 | −0.82 | +2.78 |
| HYG | −0.36 | −0.26 | −0.06 | +0.10 | +3.68 |
| TIP | −0.25 | −0.30 | −0.19 | −0.19 | +0.90 |
| EMB | −0.21 | −0.28 | −0.19 | +0.03 | +1.90 |
| MUB | −0.15 | −0.20 | −0.16 | −0.06 | +0.26 |
| BKLN | −0.01 | +0.16 | +0.14 | +0.23 | +1.49 |
| SCHD | −0.65 | +0.49 | +2.34 | +2.50 | +5.88 |
| Model total | −2.66 | −1.77 | +0.89 | +1.73 | +18.94 |
Calculation and data notes
Returns are independently compounded from the supplied daily backtest series. The policy benchmark applies fixed weights to daily ETF returns, effectively a daily constant-weight comparator. Absolute contributions use each day’s beginning-period model wealth and ETF weight, producing an exact cumulative-return reconciliation. All figures use the workbook’s return scaling and distribution treatment. The report makes no separate price-versus-income decomposition.
Calendar-period returns differ from the dashboard’s rolling 252- and 756-session figures. The supplied workbook is a historical model simulation; no verified live-account inception or execution record was supplied. Returns exclude a separate deduction for advisory fees, trading commissions, bid–ask spreads or market impact. ETF expenses may be reflected in the underlying total-return series.
August 31 HY and IG spreads and the advance–decline line inputs are missing. The workbook’s guards substitute neutral values in affected calculations, even though its overall data flag passes. The report preserves that history rather than reconstructing signals. Consequently, August-end regime readings and the September 1 policy reset should be interpreted with this data limitation in mind.
Sources
[1] Supplied ETFFI Core Aggressive Model Working Copy (3), through September 30, 2026: configuration, daily data, indicators, strategy, backtest and attribution sheets. Market inputs supplied through the model workbook.
[2] Federal Reserve, September 16, 2026 FOMC statement. federalreserve.gov/newsevents/pressreleases/monetary20260916a.htm
[3] BLS, August 2026 CPI release, September 11, 2026. bls.gov/news.release/archives/cpi_09112026.htm
[4] BEA, Personal Income and Outlays, August 2026, released September 30. bea.gov/news/2026/personal-income-and-outlays-august-2026
[5] BLS, August 2026 employment release and next-release schedule. bls.gov/news.release/archives/empsit_09042026.htm
[6] Federal Reserve, 2026 FOMC calendar. federalreserve.gov/monetarypolicy/fomccalendars.htm
For research and educational purposes. Model results are hypothetical and do not guarantee future results. Bond, credit, equity and currency exposures can lose value. Portfolio suitability depends on the investor’s objectives and constraints.