
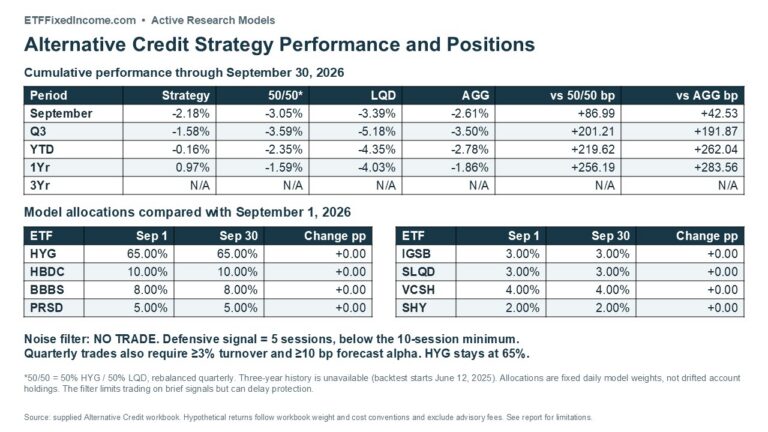
September absolute and excess returns
The ETFFI Alternative Credit Strategy returned −2.18% in September, outperforming its primary 50% HYG / 50% LQD benchmark by 86.99 basis points. The benchmark declined 3.05%, while LQD fell 3.39% and AGG declined 2.61%. The strategy’s advantage was 120.57 basis points versus LQD and 42.53 versus AGG. Shorter corporate exposures reduced the damage from rising yields, but a 65% HYG allocation left the portfolio exposed to widening high-yield spreads.
The primary benchmark evaluates the strategy against a blended corporate-credit allocation. LQD provides the workbook’s investment-grade corporate comparison; AGG adds the broad bond-market reference used across this report series. Relative gains against these comparators reflect different duration and credit exposures and should not be interpreted as pure timing alpha.
| Period | Strategy | 50/50 | LQD | AGG | vs 50/50 bp | vs AGG bp |
| September | -2.18% | -3.05% | -3.39% | -2.61% | +86.99 | +42.53 |
| Q3 | -1.58% | -3.59% | -5.18% | -3.50% | +201.21 | +191.87 |
| YTD | -0.16% | -2.35% | -4.35% | -2.78% | +219.62 | +262.04 |
| 1Yr | 0.97% | -1.59% | -4.03% | -1.86% | +256.19 | +283.56 |
| 3Yr | N/A | N/A | N/A | N/A | N/A | N/A |
| Since inception | 4.12% | 2.42% | 0.32% | 1.44% | +170.12 | +268.10 |
Cumulative total returns. 50/50 means 50% HYG / 50% LQD, rebalanced quarterly with daily weight drift. Since inception is June 12, 2025 through September 30, 2026. Three-year results are unavailable. Strategy returns follow the supplied workbook’s daily weight and cost conventions, described in the calculation notes. Results are hypothetical and exclude advisory fees.
Strategy level attribution summary
September’s relative resilience came primarily from avoiding LQD’s longer corporate-duration exposure. That omission contributed 165.90 basis points versus the blended benchmark. The larger HYG allocation detracted 38.63 basis points, while the other seven ETF sleeves collectively detracted 40.29. The resulting advantage was 86.99 basis points, despite losses in every held ETF during the month.
For Q3, the strategy returned −1.58%, beating the blended benchmark by 201.21 basis points and AGG by 191.87. Year to date, it returned −0.16%, ahead by 219.62 and 262.04 basis points, respectively. Over one year, the strategy gained 0.97%, versus −1.59% for the blend, −4.03% for LQD and −1.86% for AGG. Its one-year advantages were 256.19 basis points versus the blend and 283.56 versus AGG.
Since the June 2025 start of the backtest, the strategy gained 4.12%, versus 2.42% for the blend, 0.32% for LQD and 1.44% for AGG. This short record supports a discussion of diversification and duration exposure, but does not establish performance through a full credit cycle. No three-year return or attribution has been estimated.
The live regime is Defensive cash, while the allocation remains Balanced income. The October review indicates no trade. Recent outperformance therefore belongs principally to the existing portfolio structure, rather than a newly implemented defensive allocation.
October position update
Published model allocations are unchanged from September 1. HYG remains 65%, HBDC 10% and BBBS 8%, with PRSD at 5%, IGSB and SLQD at 3% each, VCSH at 4% and SHY at 2%. These are the weights applied in the workbook’s daily backtest, not independently verified, drifted account holdings.
| ETF | Sep 1 model | Sep 30 model | Change pp | Defensive template |
| HYG | 65.00% | 65.00% | +0.00 | 20.00% |
| HBDC | 10.00% | 10.00% | +0.00 | 5.00% |
| BBBS | 8.00% | 8.00% | +0.00 | 5.00% |
| PRSD | 5.00% | 5.00% | +0.00 | 5.00% |
| IGSB | 3.00% | 3.00% | +0.00 | 20.00% |
| SLQD | 3.00% | 3.00% | +0.00 | 25.00% |
| VCSH | 4.00% | 4.00% | +0.00 | 10.00% |
| SHY | 2.00% | 2.00% | +0.00 | 10.00% |
The defensive template is a conditional regime allocation, not an approved October trade. It would reduce HYG to 20%, HBDC to 5% and BBBS to 5%, while leaving PRSD at 5%. IGSB would rise to 20%, SLQD to 25%, VCSH to 10% and SHY to 10%. The current pending decision retains Balanced income instead.
The exposures behind the allocations
HYG drives the portfolio’s high-yield income and spread sensitivity. HBDC holds bonds issued by business development companies, bringing exposure to specialty-finance issuers and their underlying lending businesses. Its 10% allocation is a bond exposure rather than BDC common equity. BBBS concentrates on BBB-rated corporate bonds with maturities of one to five years, limiting maturity exposure while retaining downgrade and spread risk. [4–5]
PRSD adds short-duration investment-grade public and private credit. Its contribution depends on credit selection and liquidity as well as rates. IGSB, SLQD and VCSH provide additional short corporate exposure; SHY supplies a small Treasury reserve. These sleeves diversify the sources of income, but 65% in HYG means the strategy remains sensitive to a broad deterioration in below-investment-grade credit. [6]
The last recorded allocation change added PRSD on October 1, 2025. The log labels that trade as PRSD adoption even though its forecast alpha was below the normal hurdle. It should be understood as an implementation exception, not evidence that the routine alpha test passed. No subsequent regime allocation change is recorded through September 30, 2026.
How the model filters market noise
| Decision input | September 30 reading | Interpretation |
| Live regime | Defensive cash | Held regime remains Balanced income |
| Persistence | 5 sessions; minimum 10 | Fails the persistence requirement |
| Pending turnover | 0.00% | No allocation change submitted |
| Pending forecast alpha | 0.00 bp | Retained allocation, not defensive forecast |
| Last recorded allocation change | October 1, 2025 | PRSD adoption into policy mix |
The live signal describes market conditions; the noise filter determines whether that diagnosis is persistent enough to change allocations. A new regime must last at least 10 trading sessions before it can change the proposed allocation. Trades occur only at quarterly reviews using the prior session’s signal. Reaching 10 sessions between reviews does not automatically trigger an intramonth trade.
At September 30, Defensive cash had persisted for five sessions. The proposed regime therefore remains Balanced income. Pending turnover and forecast alpha are zero because the model retains that allocation; these values are not forecasts for the defensive template. The other gates require at least 3% one-way turnover and 10 basis points of forecast alpha after the 25% shrink factor reduces reliance on recent performance.
Confidence of 80.08% and a live overlay flag of one do not override these conditions. The filter reduces the chance of trading on a brief reversal, but can delay protection when a genuine deterioration develops quickly. Investors should judge exposure from the current allocations, including 65% HYG, rather than from the defensive regime label alone.
Indicator and signal recap
The live regime moved from Balanced income at August-end to Defensive cash at September-end. Confidence rose from 54.82% to 80.08%, and the live overlay flag moved from zero to one. The deterioration in credit and the rise in defensive pressure explain the change in the signal. Quarterly implementation rules explain why the portfolio has not followed it.
| Signal | August 31 | September 30 | Change |
| Credit | +0.07 | −0.64 | −0.71 |
| Duration | −1.00 | −1.00 | +0.00 |
| Inflation | −1.00 | −1.00 | +0.00 |
| Defensive | +0.02 | +1.00 | +0.98 |
| Breadth | +0.20 | +0.05 | −0.15 |
| Floating Rate | +0.15 | −0.11 | −0.27 |
Credit fell from +0.07 to −0.64, while Defensive rose from +0.02 to +1.00. Breadth weakened from +0.20 to +0.05, reducing confirmation from the wider market. Floating Rate moved from +0.15 to −0.11. Together, those readings favor less credit exposure and a larger allocation to short, higher-quality instruments. They do not establish that the model has executed those changes.
Duration and Inflation remain at −1.00. These are portfolio signals, not forecasts of reported inflation. The duration reading supports restraint on rate sensitivity, while weaker credit and breadth explain the preference for the defensive template.
September market recap and October outlook
September combined renewed inflation pressure with higher discount rates. On September 16, the Federal Reserve raised the federal funds target range by 25 basis points to 3.75%–4.00%. August CPI increased 0.4% month over month and 3.4% year over year. August PCE inflation subsequently registered 3.4% year over year, with core PCE at 3.0%. These releases reduced the case for near-term monetary relief. [1–3]
The supplied ETF returns show the distinction between duration protection and capital preservation. LQD lost 3.39%, HYG fell 2.73%, and AGG declined 2.61%. The strategy’s shorter corporate sleeves generally declined less, yet none delivered a positive September return. HYG alone contributed approximately −1.78 percentage points to the strategy’s −2.18% result, making high-yield exposure the dominant absolute return driver.
October outlook
Our October assessment favors maintaining income exposure with close attention to credit quality and refinancing risk. The policy backdrop argues for caution on longer duration, but a 65% HYG allocation is also vulnerable if slower demand translates into weaker cash flow or higher default expectations. The model’s defensive signal recognizes that risk; its persistence rule delays implementation until the regime is established.
Household demand remains resilient but increasingly dependent on spending outpacing income. August real consumption rose 0.6%, while real disposable income was unchanged and the saving rate stood at 4.1%. Continued spending supports corporate revenue, but limited income growth leaves borrowers more exposed to sustained financing costs. Tariff-related input pressure would add another potential squeeze on margins. These are risks to monitor, rather than a forecast of imminent credit deterioration. [3]
If spreads stabilize, the retained HYG allocation preserves participation in a credit recovery. If credit conditions weaken further, the gap between the current 65% HYG weight and the defensive template’s 20% becomes consequential. A strong duration rally poses a different opportunity cost because the strategy lacks the benchmark’s LQD allocation. The next regime shift must satisfy the quarterly trade rules; a stronger defensive reading by itself is not an executed trade.
Performance attribution versus the benchmarks
The following contributions explain the strategy’s cumulative return difference versus the 50% HYG / 50% LQD benchmark. HYG represents the effect of the strategy’s larger allocation. Other held ETF rows show exposures absent from the benchmark; the LQD row measures the effect of not holding the benchmark’s LQD sleeve. These are allocation contributions, not claims of security-selection alpha.
| Contribution bp | Sep | Q3 | YTD | 1Yr | 3Yr |
| HYG | −38.63 | −28.28 | −4.75 | +13.69 | N/A |
| HBDC | −13.08 | −5.62 | +0.73 | +4.92 | N/A |
| BBBS | −10.26 | −9.56 | −2.09 | +6.98 | N/A |
| PRSD | −4.44 | −2.26 | +5.27 | +10.81 | N/A |
| IGSB | −3.75 | −3.32 | −0.48 | +3.19 | N/A |
| SLQD | −2.77 | −2.02 | +1.30 | +4.81 | N/A |
| VCSH | −4.92 | −4.51 | −0.94 | +3.93 | N/A |
| SHY | −1.07 | −0.44 | +0.71 | +2.83 | N/A |
| LQD omission | +165.90 | +257.22 | +219.89 | +205.21 | N/A |
| Modeled cost difference | +0.00 | −0.01 | −0.01 | −0.17 | N/A |
| Strategy minus 50/50 | +86.99 | +201.21 | +219.62 | +256.19 | N/A |
| 50/50 minus LQD | +33.59 | +159.30 | +199.89 | +244.13 | N/A |
| Strategy minus LQD | +120.57 | +360.52 | +419.52 | +500.32 | N/A |
| 50/50 minus AGG | −44.46 | −9.34 | +42.42 | +27.38 | N/A |
| Strategy minus AGG | +42.53 | +191.87 | +262.04 | +283.56 | N/A |
Basis points of cumulative return difference. Totals use unrounded values. Rows below Strategy minus 50/50 bridge the primary benchmark result to LQD and AGG. Three-year attribution is unavailable because the backtest begins in June 2025.
What drove the relative results
The LQD omission contributed 165.90 basis points in September and 257.22 in Q3. In both periods, the benefit exceeded the strategy’s overall outperformance because HYG and the other held sleeves also lost value. The September HYG overweight cost 38.63 basis points relative to the blend, followed by HBDC at −13.08 and BBBS at −10.26. Diversification reduced the loss relative to the benchmark without eliminating the drawdown.
Year to date, avoiding LQD contributed 219.89 basis points, almost the entirety of the strategy’s 219.62-basis-point advantage. PRSD added 5.27 basis points and SLQD 1.30, while HYG detracted 4.75 and BBBS 2.09. Over one year, the LQD omission contributed 205.21 of the 256.19-basis-point advantage, with positive contributions from every held sleeve before modeled cost differences.
The practical interpretation is that shorter corporate exposure and the existing policy mix have done most of the work. The record does not support attributing September’s relative gain to a defensive trade: none occurred. Comparisons with AGG also include differences in sector composition and credit quality, so they should remain a portfolio-level reference.
Attribution method
Daily allocation contributions use the workbook’s strategy weights and the benchmark’s drifting beginning-of-day HYG and LQD weights. Carino logarithmic linking reconciles daily effects and modeled cost differences to the compounded strategy-minus-benchmark return. The LQD and AGG bridge rows are arithmetic differences between cumulative portfolio returns, not bond-level attribution.
Contributions to total strategy return
Absolute contributions show which ETFs generated gains or losses, in percentage points of cumulative strategy return. They include compounding and a separate row for the workbook’s modeled transaction-cost deductions.
| Contribution pp | Sep | Q3 | YTD | 1Yr | 3Yr |
| HYG | −1.78 | −1.30 | −0.22 | +0.59 | N/A |
| HBDC | −0.13 | −0.06 | +0.01 | +0.06 | N/A |
| BBBS | −0.10 | −0.10 | −0.02 | +0.07 | N/A |
| PRSD | −0.05 | −0.02 | +0.05 | +0.11 | N/A |
| IGSB | −0.04 | −0.03 | −0.00 | +0.03 | N/A |
| SLQD | −0.03 | −0.02 | +0.01 | +0.05 | N/A |
| VCSH | −0.05 | −0.05 | −0.01 | +0.04 | N/A |
| SHY | −0.01 | −0.00 | +0.01 | +0.03 | N/A |
| Modeled trading costs | +0.00 | −0.00 | −0.00 | −0.00 | N/A |
| Strategy total | −2.18 | −1.58 | −0.16 | +0.97 | N/A |
HYG accounted for approximately 81% of September’s loss, contributing −1.78 percentage points. HBDC contributed −0.13 and BBBS −0.10, with the remaining sleeves contributing smaller losses. Over one year, HYG contributed +0.59 percentage point and PRSD +0.11, while all other ETF contributions were positive. Small cost deductions round to 0.00 at this display precision.
Calculation and implementation notes
Returns compound supplied daily series and reconcile to the workbook’s strategy, 50/50 and LQD NAVs. AGG comes from ETF Return Data. One year covers October 1, 2025 through September 30, 2026. History begins June 12, 2025; three-year results are unavailable. All results exclude advisory fees and taxes.
The strategy applies fixed decision weights daily, while the benchmark drifts between quarterly resets. Model weights therefore are not drifted account holdings. This difference limits interpretation as an implemented quarterly portfolio. The workbook also deducts 3 basis points times recorded turnover on some quarter starts marked No trade. We retain those deductions; they do not establish the full cost of maintaining daily fixed weights.
Before PRSD data became available, its 5% allocation was divided between IGSB and SLQD. PRSD entered the strategy on October 1, 2025. The workbook flags 62 days without PRSD data. The short history does not cover a full credit cycle.
Sources
[1] Federal Reserve, September 16, 2026 FOMC statement. federalreserve.gov/newsevents/pressreleases/monetary20260916a.htm
[2] Bureau of Labor Statistics, August 2026 CPI. bls.gov/news.release/archives/cpi_09112026.htm
[3] Bureau of Economic Analysis, August 2026 Personal Income and Outlays, September 30 release. bea.gov/index.php/news/2026/personal-income-and-outlays-august-2026
[4] Hilton BDC Corporate Bond ETF, fund objective and exposure. hiltonetfs.com/bdc-corporate-bond-etf
[5] BondBloxx BBB Rated 1–5 Year Corporate Bond ETF, fund description. bondbloxxetf.com/BondBloxx-BBB-Rated-1-5-Year-Corporate-Bond-ETF/
[6] State Street Short Duration IG Public & Private Credit ETF, fund description. ssga.com/us/en/individual/etfs/state-street-short-duration-ig-public-private-credit-etf-prsd
[7] Supplied ETFFI_Alternative_Credit_Strategy_Updated.xlsx, through September 30, 2026: daily returns, decision log, model configuration and signals. ETF return data sourced from FactSet Research Systems Inc. as supplied in the research workflow.
For research and educational purposes. Results are hypothetical and do not guarantee future performance. Credit, interest-rate and liquidity risks can cause losses. Model allocations are not individualized investment advice
