
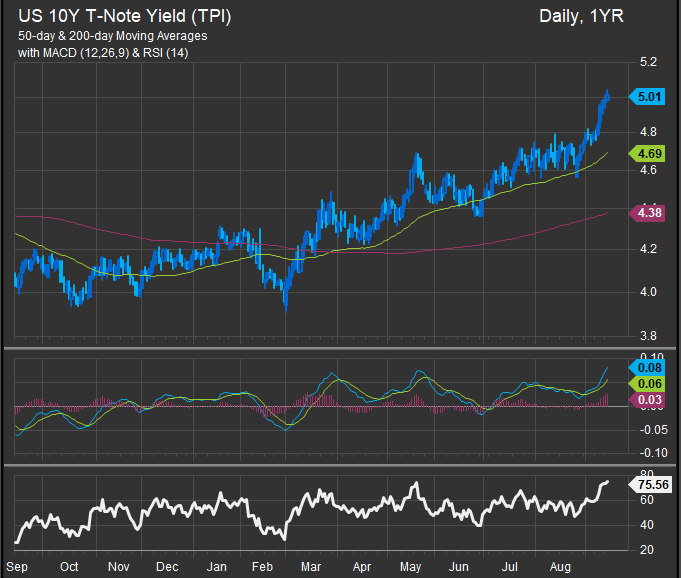
Brent above $107 and Treasury yields at multi-year highs are reinforcing inflation concerns and keeping long duration tactical as the FOMC begins its two-day meeting.
The Lead
The 10-year Treasury moved above 5% in early Tuesday trading, extending a selloff that has taken benchmark yields to their highest levels since 2007. The move is increasingly being driven by the combination of higher oil prices and renewed expectations for additional Federal Reserve tightening. Reuters reported the 10-year near 5.03% this morning, roughly 7 bps higher on the session.
Energy remains the critical macro catalyst. Brent crude traded above $107 Tuesday after fresh attacks on Saudi energy infrastructure and disruption to the East-West pipeline intensified concerns about Gulf supply. Shipping traffic through the Strait of Hormuz has also fallen sharply. The resulting energy shock is strengthening the inflation argument just as the Fed begins its September meeting.
Monday’s FactSet close already showed a difficult setup: the 10-year at 4.983%, 30-year at 5.346%, 10-year real yield at 2.60%, WTI at $101.39, and MOVE at 83.9. The 2-year rose more than the long end Monday, flattening the curve as tightening expectations continued to rebuild.
Markets now assign roughly a 92% probability of a Fed rate increase Wednesday, according to Reuters. The preferred posture remains an income-oriented allocation—collecting yield from lower-volatility bond segments rather than relying on a sharp decline in Treasury rates to drive total return. Maintain exposure to ultrashort Treasuries, shorter high-quality credit, AAA CLOs and selective TIPS while treating long duration tactically.
Rates Tape
| Market | Latest | 1D Change | 1W Change |
| 2Y Treasury | 4.652% | +2.3 bps | +25.8 bps |
| 10Y Treasury | 4.983% | +1.0 bp | +19.0 bps |
| 30Y Treasury | 5.346% | -0.9 bp | +9.9 bps |
| 2s10s Curve | +33.2 bps | -1.3 bps | -6.8 bps |
| 5s30s Curve | +53.3 bps | -3.2 bps | -14.8 bps |
September 14 closing readings; Tuesday’s 10-year yield has subsequently moved above 5% in early trading.
Duration performance remained weak over the past week despite Monday’s modest stabilization. TLT gained 0.07% Monday but remained down 1.55% for the week, while IEF fell 0.09% Monday and 1.33% over one week. The deeper-duration EDV remained down 1.81% for the week.
Macro Signal Board
| Signal | Latest | 1D Change | 1W Change | 1Y Pctl. | Trading Read |
| 10Y Treasury | 4.983% | +1.0 bp | +19.0 bps | 100th | 5% threshold now breaking |
| 30Y Treasury | 5.346% | -0.9 bp | +9.9 bps | 99th | Long-end yields remain historically high |
| 10Y Real Yield | 2.60% | 0 bps | +17 bps | 100th | Strong competition for risk assets |
| 10Y Breakeven | 2.37% | +1 bp | 0 bps | 82nd | Inflation compensation elevated |
| Fed Funds Implied Rate | 3.875% | +1.5 bps | +9 bps | 84th | Market rebuilding tightening expectations |
| IG OAS | 80 bps | 0 bps | -1 bp | 66th | Little additional credit compensation |
| HY OAS | 271 bps | +6 bps | +4 bps | 21st | Spreads widening, but still relatively tight |
| MOVE | 83.9 | +1.7 | +7.8 | 93rd | Rate volatility remains elevated |
| WTI Crude | $101.39 | +$1.34 | +$8.36 | 94th | Inflation risk elevated |
Monday’s close already had nominal yields, real yields, oil and rate volatility clustered near the upper end of their one-year ranges. Tuesday’s move above 5% in the 10-year and another increase in oil make that combination still more challenging. Credit spreads have started to respond—HY OAS widened 6 bps Monday—but spread compensation remains modest relative to the magnitude of the rate and inflation shock.
Calendar Watch
There were no major U.S. economic releases in Monday’s September 14 calendar, leaving the rates move primarily driven by energy, Fed repricing and global bond-market pressure.
Today’s calendar begins with the new weekly ADP employment measure, followed by the Empire State Manufacturing Survey.
| Time | Release | Consensus | Prior |
| 8:15 a.m. ET | ADP Weekly Employment Change | — | +12,000 |
| 8:30 a.m. ET | Empire State Manufacturing Index | 11.1 | 20.6 |
Empire State will offer a fresh read on manufacturing activity, but the larger event is already underway: the FOMC meets September 15–16, with the decision due Wednesday at 2:00 p.m. ET and the press conference at 2:30 p.m. This meeting also includes updated economic projections.
Friday’s August CPI remains central to the debate. Headline inflation rose 0.4% M/M and 3.4% Y/Y, while gasoline rose 3.9% during the month and core prices increased 0.3%. With oil prices rising again since that report, the Fed faces a less comfortable inflation backdrop than it did earlier this month.
ETF Flow Leaders
| ETF | Segment | 1W Return | 1W Flows | 1M Flows |
| SGOV | Ultrashort Treasury | +0.05% | +$1.95B | +$6.70B |
| TLT | Long Treasury | -1.55% | +$1.37B | +$2.58B |
| BND | Broad Market | -1.00% | +$788M | +$2.98B |
| USFR | Floating-Rate Treasury | +0.08% | +$753M | +$964M |
| BIL | Treasury Bills | +0.04% | +$551M | +$842M |
| IEF | 7–10Y Treasury | -1.33% | +$384M | -$310M |
| VTEB | Municipal Bonds | -0.94% | +$381M | +$678M |
| BNDX | International Aggregate | -0.97% | +$352M | +$1.10B |
The flow leadership continues to show a pronounced barbell between liquidity and duration. SGOV attracted nearly $2.0 billion over the week, while USFR and BIL also posted strong inflows. At the opposite end of the curve, investors added $1.37 billion to TLT despite a 1.55% weekly loss, suggesting continued attempts to buy the Treasury selloff rather than broad capitulation in duration.
Credit is telling a different story. LQD lost $1.89 billion over the past week and $5.12 billion over one month, while HYG lost $960 million for the week and $3.42 billion over one month. VCIT also saw $577 million in weekly outflows. That divergence argues that investors are more willing to add Treasury duration than corporate spread duration at current valuations.
Municipal demand improved sharply Monday: VTEB took in $665 million in one day, lifting its weekly flow to +$381 million, although MUB remained negative over the week. Meanwhile, JAAA attracted another $281 million over one week and $842 million over one month, reinforcing demand for high-quality floating-rate credit.
Trading Implications
- Core bonds: Maintain core exposure through BND/AGG, but keep portfolio duration moderate. Current yield levels improve long-run return potential, but the near-term repricing is not yet settled.
- Duration: TLT inflows remain strong, but a 10-year above 5%, a 2.60% real yield and elevated MOVE argue against chasing the long end. Treat TLT, VGLT, EDV and ZROZ as tactical positions until the Fed decision and oil shock stabilize.
- Credit: Favor short/intermediate investment grade rather than long-duration corporate credit. Heavy LQD and VCIT outflows indicate investors are reducing combined rate-and-spread exposure.
- High yield: Remain selective. HY OAS widened to 271 bps, but spreads remain toward the tight end of their one-year range and HYG continues to lose assets.
- Cash management: SGOV, USFR, BIL and other short-rate exposures remain attractive while markets price additional Fed tightening.
- Munis: The large one-day VTEB inflow suggests buyers are responding to cheaper valuations. Favor short/intermediate municipal exposure while the long end remains volatile.
- TIPS / inflation hedges: The combination of 2.60% real yields, oil above $100 and renewed energy-inflation risk keeps shorter-duration TIPS attractive. VTIP has taken in roughly $188 million over the past week and $744 million over one month.
- CLOs / loans: JAAA remains one of the cleaner income exposures in the current setup, combining positive weekly returns with persistent inflows and limited duration. Senior loans also benefit mechanically from higher short rates, but credit selection matters if tighter policy begins to slow growth.
Bottom Line
The fixed income market has shifted from debating whether the 10-year would test 5% to determining how far above 5% yields can move if oil remains elevated and the Fed resumes tightening. The combination of high real yields, rising energy prices and elevated rate volatility argues for income over duration. Stay overweight ultrashort and high-quality floating-rate exposure, maintain selective core bonds and TIPS, and keep long Treasuries and longer-duration corporate credit tactical ahead of Wednesday’s FOMC decision.
Sources
- FactSet Research Systems Inc., ETFFixedIncome.com Fund Universe Return & Flow Database, September 15, 2026.
- FactSet Research Systems Inc., September 15, 2026 rates, credit, volatility, commodity, FX and economic-calendar data; latest closing readings through September 14, 2026.
- Federal Reserve, September 15–16, 2026 FOMC meeting calendar and release schedule.
- Federal Reserve Bank of New York, September 2026 Economic Indicators Calendar.
- U.S. Bureau of Labor Statistics, August 2026 Consumer Price Index.
- Reuters, September 15, 2026, Treasury yields, Federal Reserve expectations and global market reaction.
- Reuters, September 15, 2026, oil markets, Saudi energy infrastructure and Strait of Hormuz developments.
Disclaimer: This commentary is for informational and educational purposes only and should not be considered investment advice. ETF return and flow data can change quickly and may reflect short-term trading activity rather than durable allocation trends. Fixed income investments are subject to interest-rate risk, credit risk, liquidity risk, inflation risk, tax considerations, and potential loss of principal.

