
The Lead
A near-certain quarter-point Fed hike meets $100-plus crude, 2.62% real yields and weakening corporate-credit demand, keeping income attractive while long duration remains tactical.
Treasuries enter Fed decision day with the 10-year yield above 5% for the first close in the current selloff. Tuesday ended with the 2-year at 4.669%, 10-year at 5.001% and 30-year at 5.367%. Over the past week, the 2-year has risen roughly 28 bps, the 10-year 21 bps and the 30-year 12 bps, leaving the curve flatter as markets rebuild expectations for tighter monetary policy.
The immediate inflation pressure is coming from energy. WTI jumped another $4.44 Tuesday to $105.83, taking its one-week increase to nearly $13 per barrel. Oil has eased modestly this morning—WTI was around $104 and Brent near $108—but both remain high enough to complicate the inflation outlook. Meanwhile, the 10-year Treasury yield is holding around the 5% threshold after touching its highest level since 2007 on Tuesday.
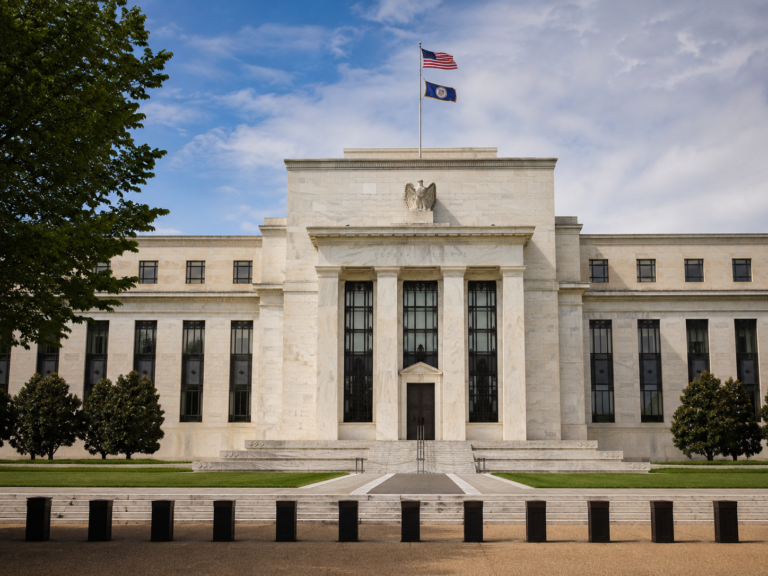
The Fed releases its decision and updated economic projections at 2:00 p.m. ET, followed by Chair Kevin Warsh’s press conference at 2:30. Markets are pricing roughly a 92.5% probability of a 25 bp rate increase, up sharply from 61.2% one week ago. The hike itself is therefore heavily discounted; the more important fixed income catalyst may be the new rate projections and Warsh’s characterization of whether today’s move is sufficient or the beginning of a broader tightening cycle.
Preferred positioning remains an income-oriented allocation—collecting yield from lower-volatility bond segments rather than relying on a sharp decline in Treasury rates to drive total return. Favor ultrashort Treasuries, shorter high-quality bonds, AAA CLOs and selective inflation protection; keep long Treasury and long-credit exposure tactical through the Fed.
Rates Tape
| Market | Latest | 1D Change | 1W Change |
| 2Y Treasury | 4.669% | +1.8 bps | +27.6 bps |
| 10Y Treasury | 5.001% | +1.8 bps | +20.8 bps |
| 30Y Treasury | 5.367% | +2.2 bps | +12.1 bps |
| 2s10s Curve | +33.2 bps | Flat | -6.7 bps |
| 5s30s Curve | +53.5 bps | +0.2 bp | -14.6 bps |
September 15 closing readings; one-week changes versus September 8.
Long-duration ETFs continued to absorb the rates shock. TLT fell 0.27% Tuesday and 1.25% over the week, while IEF lost 1.17% for the week and VGLT fell 1.84%. The flow picture is more nuanced: TLT still has +$1.03B of weekly inflows, but Tuesday alone saw $534M leave the fund, suggesting dip-buying remains intact but conviction weakened as the 10-year crossed 5%.
Macro Signal Board
| Signal | Latest | 1D | 1W | 1Y Pctl. | Trading Read |
| 10Y Treasury | 5.001% | +1.8 bps | +20.8 bps | 100th | 5% threshold breached |
| 30Y Treasury | 5.367% | +2.2 bps | +12.1 bps | 100th | Long end remains under pressure |
| 10Y Real Yield | 2.62% | +2 bps | +19 bps | 100th | High hurdle for duration and risk assets |
| 10Y Breakeven | 2.38% | +1 bp | +1 bp | 87th | Inflation compensation elevated |
| Fed Funds Implied Rate | 3.875% | Flat | +9 bps | 84th | Tightening repricing largely complete |
| IG OAS | 80 bps | Flat | -1 bp | 66th | Limited spread cushion |
| HY OAS | 276 bps | +5 bps | +9 bps | 37th | Credit beginning to react |
| MOVE | 83.7 | -0.2 | +7.6 | 93rd | Rates volatility remains elevated |
| WTI Crude | $105.83 | +$4.44 | +$12.80 | 98th | Energy shock remains inflationary |
The macro mix remains unfavorable for a broad duration overweight. Nominal yields and real yields are at the top of their trailing one-year ranges, oil is close to its one-year extreme and rates volatility remains elevated. Credit is finally showing some response—HY spreads widened another 5 bps Tuesday—but corporate spreads have not repriced nearly as much as Treasury rates or energy risk.
Calendar Watch
Tuesday’s data offered some evidence of slower manufacturing momentum but little to change the Fed debate. ADP’s weekly employment estimate rose 16,250, versus a revised 12,250 previously. The Empire State Manufacturing Index fell to 7.6, well below the 12.1 consensus and down from 20.6 in August.
Today’s calendar is substantially more important:
| Time | Release | Consensus | Prior |
| 8:30 a.m. | Retail Sales M/M | +0.70% | -0.60% |
| 8:30 a.m. | Retail Sales ex-Auto | +0.50% | -0.30% |
| 8:30 a.m. | Retail Sales Control Group | +0.30% | -0.44% |
| 8:30 a.m. | Import Prices M/M | +0.10% | -0.40% |
| 8:30 a.m. | Export Prices M/M | +0.50% | -1.30% |
| 10:00 a.m. | NAHB Housing Market Index | 34 | 35 |
| 2:00 p.m. | FOMC Decision + Economic Projections | — | — |
The Fed’s September 15–16 meeting is one of the quarterly meetings accompanied by a Summary of Economic Projections. The policy statement and projections are scheduled for 2:00 p.m., followed by the press conference at 2:30 p.m.
A strong retail-sales print would reinforce the case that domestic demand remains resilient despite higher borrowing costs. A weak print could complicate the message: markets are already positioned for a hike primarily because inflation remains elevated, meaning softer consumption would increase the tension between inflation control and growth risk.
ETF Flow Leaders
| ETF | Segment | 1W Return | 1W Flows | 1M Flows |
| SGOV | Ultrashort Treasury | +0.04% | +$2.02B | +$7.01B |
| TLT | Long Treasury | -1.25% | +$1.03B | +$2.05B |
| VTEB | Municipal Bonds | -0.80% | +$942M | +$1.23B |
| BIL | Treasury Bills | +0.05% | +$653M | +$969M |
| BND | Broad Market | -0.81% | +$586M | +$3.08B |
| AGG | Broad Market | -0.86% | +$365M | +$1.40B |
| IEF | 7–10Y Treasury | -1.17% | +$311M | -$382M |
| USFR | Floating-Rate Treasury | +0.12% | +$251M | +$924M |
The flow tape remains barbelled. SGOV continues to dominate with more than $2.0B of weekly inflows, joined by strong demand for BIL and USFR. At the other end of the curve, TLT continues to attract assets despite negative returns, showing that investors are willing to buy cheaper Treasury duration—but not yet with enough conviction to reverse the trend.
The most striking divergence remains corporate credit. LQD lost $1.80B over one week and $5.03B over one month, HYG lost $803M for the week and $3.29B over one month, and VCIT lost $502M. Investors appear more comfortable adding risk-free duration than combining duration with tight corporate spreads.
Munis are a notable exception. VTEB attracted $942M over the past week, including $554M Tuesday, even as the ETF lost 0.80%. JAAA also continues to show defensive demand, gaining 0.10% for the week while attracting $202M.
Trading Implications
- Core bonds: BND/AGG yields are materially more attractive after the selloff, but retain moderate duration until today’s Fed guidance clarifies whether additional hikes remain likely.
- Duration: Do not chase TLT/VGLT/EDV simply because the 10-year crossed 5%. Weekly inflows show growing valuation interest, but 2.62% real yields and elevated MOVE argue for tactical rather than strategic long-duration exposure.
- Credit: Favor shorter high-quality corporate exposure over long-duration investment grade. LQD outflows and an 80 bp IG OAS leave limited compensation for simultaneously taking duration and spread risk.
- High yield: Stay selective. HY OAS at 276 bps has begun to widen, but remains below the middle of its one-year range while HYG continues to experience substantial redemptions.
- Cash management: SGOV, BIL, USFR and similar vehicles remain the cleanest way to collect elevated short rates while preserving optionality around the Fed.
- Munis: Improving yields are attracting buyers. The strong VTEB inflow argues for selectively adding short/intermediate municipal exposure, while keeping long muni duration measured.
- TIPS / inflation hedges: Energy remains a meaningful inflation risk. VTIP has attracted roughly $153M over one week and $710M over one month, making shorter TIPS preferable to extending inflation-protected duration.
- CLOs / loans: JAAA remains a useful high-quality income sleeve with minimal duration, while floating-rate loans continue to benefit from elevated policy rates. Prefer senior quality rather than reaching down the credit spectrum.
Bottom Line
Today’s Fed decision is less about whether the market gets one 25 bp hike and more about what comes next. With the 10-year around 5%, real yields at 2.62%, WTI above $100 and credit spreads only beginning to widen, the fixed income setup still favors income over aggressive duration. Maintain ultrashort and high-quality floating-rate exposure, add core bonds selectively, and wait for the new Fed projections and Warsh press conference before materially increasing long Treasury or long-credit exposure.
Sources
- FactSet Research Systems Inc., ETFFixedIncome.com Fund Universe Return & Flow Database, September 16, 2026.
- FactSet Research Systems Inc., September 16, 2026 rates, credit, volatility, commodity, FX and economic-calendar data.
- Federal Reserve Board, September 15–16, 2026 FOMC meeting calendar and Summary of Economic Projections schedule.
- Reuters, September 16, 2026, global markets, Treasury yields, oil and Federal Reserve expectations.
- Reuters, September 16, 2026, Federal Reserve policy outlook and September meeting preview.
Disclaimer: This commentary is for informational and educational purposes only and should not be considered investment advice. ETF return and flow data can change quickly and may reflect short-term trading activity rather than durable allocation trends. Fixed income investments are subject to interest-rate risk, credit risk, liquidity risk, inflation risk, tax considerations, and potential loss of principal.

