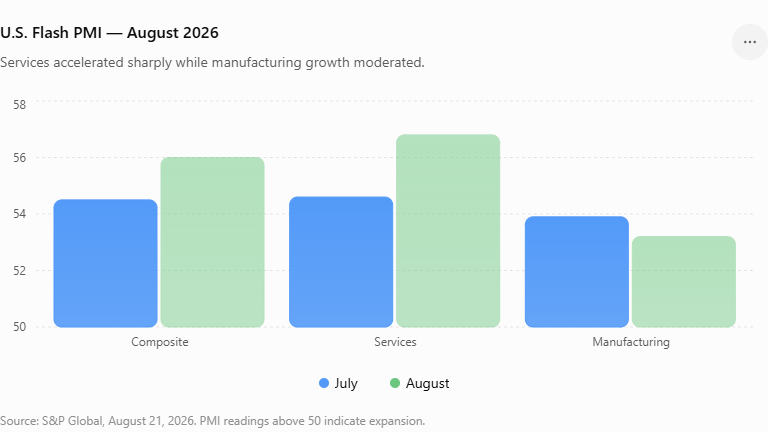
Chart: The August 21 S&P Global flash PMI delivered a clear growth surprise. Composite PMI rose to 56.0 from 54.5, its strongest reading since April 2022, driven by services jumping to 56.8 from 54.6, the strongest since December 2024. Manufacturing remained expansionary but slipped to 53.2 from 53.9.
The details were important for rates: services hiring increased at the fastest pace in 19 months, while S&P Global said the Q3 survey data were consistent with annualized GDP growth approaching 3%, versus 1.5% in Q2. Inflation pressures eased somewhat but remained elevated, leaving the report with a distinctly strong-growth, still-sticky-inflation message heading into Jackson Hole.
The Lead
Fixed income starts Monday with the long end still under pressure. The 10-year Treasury rose to 4.73%, the 30-year Treasury moved to 5.27%, and the 10-year real yield climbed to 2.40%. Those levels keep long-duration Treasuries tactical, even though Treasury buyback support and oil relief have helped stabilize the tape at times.
The problem for bonds is that growth data is not weakening enough to force a clean duration rally. August flash PMIs showed the Composite PMI rising to 56.0 and Services PMI rising to 56.8, the strongest services reading since December 2024, according to Reuters. Manufacturing slipped to 53.2, but the service-sector strength points to resilient demand.
Oil remains the offsetting inflation risk. August 24 reporting showed oil down about 2% as investors awaited U.S. sanctions details tied to Iran and the Strait of Hormuz, but markets still face uncertainty around energy supply, inflation, and Fed policy. Reuters also noted that markets were pricing roughly a 40% chance of a September Fed hike.
The setup still favors an income-oriented allocation: collecting yield from ultrashort, short-duration, intermediate investment-grade, municipal, AAA CLO, and selective core bond segments while keeping long-duration Treasury exposure tactical.
Rates Tape
| Rate | Latest | 1D Change | 1W Change |
| 2Y Treasury | 4.23% | +4.5 bp | +5.8 bp |
| 10Y Treasury | 4.73% | +3.5 bp | +4.4 bp |
| 30Y Treasury | 5.27% | +2.9 bp | +1.6 bp |
| 2s10s Curve | 50.4 bp | -1.0 bp | -1.5 bp |
| 5s30s Curve | 85.1 bp | -0.9 bp | -4.5 bp |
Long-duration ETFs recovered over the week but remain highly sensitive to yield levels. TLT gained 0.86% over the past week, ZROZ rose 1.70%, and EDV gained 1.59%. The bounce is constructive, but the 30-year Treasury above 5.25% keeps the trade tactical rather than a broad duration call.
Macro Signal Board
| Signal | Latest | 1D Change | 1W Change | 1Y Percentile | Trading Read |
| 10Y Treasury | 4.73% | +3.5 bp | +4.4 bp | 100th | Yields are at a one-year high. |
| 30Y Treasury | 5.27% | +2.9 bp | +1.6 bp | 99th | Long-end risk remains elevated. |
| 10Y Real Yield | 2.40% | +5.0 bp | -1.0 bp | 94th | Real yields still limit duration upside. |
| 10Y Breakeven | 2.34% | 0.0 bp | +7.0 bp | 64th | Inflation compensation is rising again. |
| Fed Funds Implied Rate | 3.63% | 0.0 bp | -0.3 bp | 12th | Front-end pricing remains relatively dovish. |
| IG OAS | 81 bp | -1 bp | +1 bp | 79th | IG spreads remain contained but wider than earlier this month. |
| HY OAS | 270 bp | -5 bp | +3 bp | 10th | HY spreads remain very tight. |
| MOVE Index | 73.4 | +0.2 | +3.8 | 54th | Rates volatility is manageable but higher on the week. |
| WTI Crude | $87.06 | -$0.77 | +$4.66 | 73rd | Oil remains the key inflation-risk input. |
The macro message is mixed. Front-end Fed pricing remains relatively dovish, credit stress is contained, and rates volatility is not extreme. The constraint is that nominal yields, real yields, and inflation compensation are all elevated enough to make the long end fragile.
Calendar Watch
Friday’s data was growth-positive. S&P Global Composite PMI rose to 56.0, Services PMI rose to 56.8, and Manufacturing PMI came in at 53.2. The services beat matters most for fixed income because it weakens the case for a near-term growth scare and keeps the Fed focused on inflation risk.
There are no major U.S. economic releases in the August 24 data. The week ahead is more important:
| Date | Release | Consensus | Prior |
| Aug. 25 | Consumer Confidence | 90.2 | 90.8 |
| Aug. 25 | New Home Sales | 612K | 628K |
| Aug. 26 | Durable Orders M/M | +0.40% | +0.47% |
| Aug. 26 | Q2 GDP, second prelim. | +1.7% | +1.5% prelim. |
| Aug. 26 | Core PCE M/M | +0.20% | +0.13% |
| Aug. 26 | Core PCE Y/Y | +3.2% | +3.3% |
| Aug. 27 | Initial Claims | 208K | 206K |
| Aug. 28 | Chicago PMI | 57.9 | 57.6 |
| Aug. 28 | Michigan Sentiment, final | 51.0 | 51.0 prelim. |
The week also includes Fed Chair Kevin Warsh’s Jackson Hole speech. Reuters reported that bond-market anxiety has raised the stakes for the speech, with investors looking for clarity on inflation, rate guidance, Treasury buybacks, and the Fed’s independence from fiscal policy.
ETF Flow Leaders
| ETF | Segment | 1W Return | 1W Flows | 1M Flows |
| GLD | Gold / Macro Hedge | +4.41% | +$3.38B | +$5.80B |
| SGOV | Ultra-Short Treasuries | +0.07% | +$1.81B | +$5.68B |
| VCIT | Intermediate IG Credit | +0.04% | +$1.54B | +$2.03B |
| GOVT | Treasury Bonds | +0.09% | +$639M | +$886M |
| BND | Broad Market Bonds | +0.10% | +$578M | +$2.26B |
| TLT | Long Treasuries | +0.86% | +$512M | +$4.80B |
| VGIT | Intermediate Treasuries | -0.20% | +$443M | +$850M |
| VGSH | Short Treasuries | -0.02% | +$419M | +$914M |
| IAU | Gold / Macro Hedge | +4.43% | +$311M | -$275M |
| JPST | Ultra-Short Active | +0.04% | +$288M | +$843M |
The flow signal remains barbelled. SGOV, VGSH, and JPST show continued demand for cash management and short-duration ballast. VCIT points to strong demand for intermediate investment-grade credit. BND and GOVT show core bond allocations remain active. TLT and ZROZ inflows show investors are still buying duration weakness, but the long-end yield level keeps that trade tactical.
The macro-hedge signal is the standout. GLD led weekly inflows, and IAU also attracted assets, consistent with investor demand for protection against oil, inflation, fiscal, currency, and geopolitical risks.
The caution is lower-quality credit and longer-duration corporate exposure. HYG saw $962M of weekly outflows, JNK lost $115M, BKLN lost $120M, and LQD lost $154M. VCSH also had weekly outflows despite positive one-month flows, so credit demand is selective rather than broad.
Trading Implications
Core bonds: Maintain exposure. BND, GOVT, and VGIT flows are constructive, but long-end yield levels still limit total-return confidence.
Duration: Keep long Treasuries tactical. TLT and ZROZ inflows show dip-buying, but the 30-year Treasury above 5.25%, elevated real yields, and resilient services data argue against a broad duration chase.
Credit: Prefer intermediate investment-grade exposure. VCIT is attracting strong assets, while LQD outflows show longer-duration corporate demand remains fragile.
High yield: Stay cautious. Spreads remain very tight, and HYG/JNK outflows suggest investors are reducing lower-quality risk despite firm recent spread levels.
Cash management: Keep ultrashort and short-duration ETFs in the allocation mix. SGOV, VGSH, and JPST remain key flow leaders.
Munis: Maintain tax-aware municipal exposure, but manage duration carefully. VTEB and MUB still have positive one-month flows, though weekly flows softened.
TIPS / inflation hedges: Favor short-term inflation protection and macro hedges over broad long-duration TIPS. Breakevens are rising, oil remains elevated, and gold ETF flows are strong.
CLOs / loans: Senior floating-rate credit remains useful as a volatility buffer, but BKLN outflows and modest JAAA inflows show flow support is uneven.
Bottom Line
The August 24 setup is constructive for income but still difficult for long duration. The services-led PMI strength weakens the growth-scare argument, oil remains elevated, breakevens are rising, and the 10-year Treasury is at a one-year high. ETF flows show a barbell of gold/macroeconomic hedging, SGOV/VGSH/JPST cash and short-duration demand, VCIT intermediate IG demand, broad/core bond allocations, and selective long-duration Treasury dip-buying. Keep long Treasuries and longer-duration credit tactical until the 30-year yield stabilizes more durably.
Sources
- FactSet Research Systems Inc., ETFFixedIncome.com Fund Universe Return & Flow Database, August 24, 2026
- FactSet Research Systems Inc., August 24 rates, credit, volatility, commodity, FX, and economic-calendar data
- Reuters reporting on U.S. PMIs, oil, Iran sanctions, Fed pricing, Jackson Hole, and bond-market anxiety
- CME Group / New York Fed reference materials on Fed funds futures methodology
Disclaimer: This commentary is for informational and educational purposes only and should not be considered investment advice. ETF return and flow data can change quickly and may reflect short-term trading activity rather than durable allocation trends. Fixed income investments are subject to interest-rate risk, credit risk, liquidity risk, inflation risk, tax considerations, and potential loss of principal.