The Lead
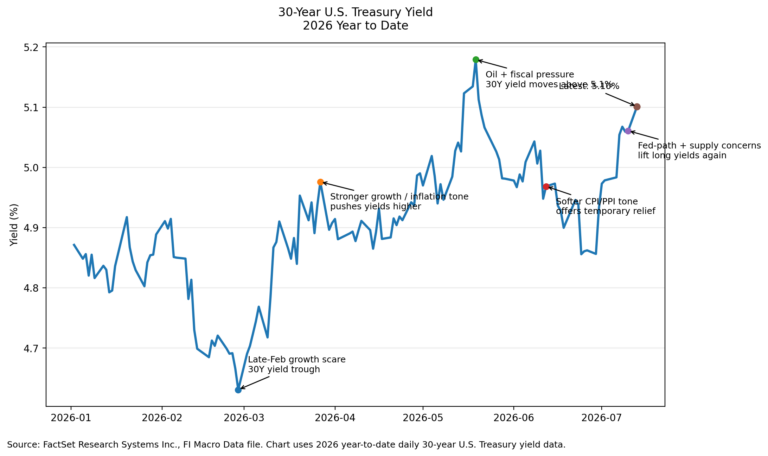
Fixed income starts Friday with the long end still under pressure after the Fed-driven bear steepening earlier in the week. The 10-year Treasury held near 4.66%, the 30-year Treasury moved to 5.21%, and the 10-year real yield remained elevated at 2.41%. The front end was steadier, with the 2-year Treasury at 4.24%.
Reuters described the bond-market reaction as a warning for the Fed, noting that 30-year Treasury yields moved above 5.2% after the Fed held rates steady at 3.50%–3.75% and three of 12 voting policymakers dissented in favor of tighter policy.
The setup still favors an income-oriented allocation: collecting yield from ultrashort, short-duration, municipal, short TIPS, and selective investment-grade segments while keeping long-duration Treasury exposure tactical.
Rates Tape
| Rate | Latest | 1D Change | 1W Change |
| 2Y Treasury | 4.24% | -0.2 bp | -11.5 bp |
| 10Y Treasury | 4.66% | -0.7 bp | -3.5 bp |
| 30Y Treasury | 5.21% | +0.8 bp | +3.9 bp |
| 2s10s Curve | 42.9 bp | -0.5 bp | +7.9 bp |
| 5s30s Curve | 83.0 bp | +2.0 bp | +11.6 bp |
The curve remains the story. Front-end yields have eased over the past week, but the 30-year remains above 5.20%. That has kept the long-duration Treasury sleeve under pressure. TLT fell 0.54% over the past week, VGLT fell 1.85%, EDV declined 1.28%, and ZROZ dropped 1.59%.
Macro Signal Board
| Signal | Latest | 1D Change | 1W Change | 1Y Percentile | Trading Read |
| 10Y Treasury | 4.66% | -0.7 bp | -3.5 bp | 99th | Yields eased slightly but remain historically high. |
| 30Y Treasury | 5.21% | +0.8 bp | +3.9 bp | 100th | Long-end risk remains at a one-year extreme. |
| 10Y Real Yield | 2.41% | 0.0 bp | -2.0 bp | 99th | Real yields remain a major duration headwind. |
| 10Y Breakeven | 2.27% | +1.0 bp | -1.0 bp | 28th | Inflation compensation remains contained. |
| Fed Funds Implied Rate | 3.64% | 0.0 bp | -8.0 bp | 16th | Front-end policy pricing remains more dovish than last week. |
| IG OAS | 80 bp | -1 bp | +1 bp | 69th | IG spreads remain contained but wider than earlier this month. |
| HY OAS | 284 bp | -3 bp | +7 bp | 49th | HY spreads eased on the day but widened over the week. |
| MOVE Index | 77.1 | +2.9 | -3.0 | 69th | Rates volatility remains elevated. |
| WTI Crude | $83.59 | -$0.87 | -$8.60 | 71st | Oil has cooled from last week’s shock but remains a macro risk. |
Oil is less acute than last week but still important. Reuters reported Friday that WTI was near $83.63, with both Brent and WTI on track for strong monthly gains as markets continue watching shipping flows and U.S.-Iran conflict risk.
Calendar Watch
Thursday’s data was mixed for bonds. Q2 GDP rose 1.5%, below 2.1% consensus, while the GDP price index rose 6.2%, well above 3.9% consensus. Core PCE rose 0.13% month over month and 3.3% year over year, both broadly constructive relative to recent inflation concerns. Personal spending rose 0.30%, below 0.45% consensus, and personal income rose 0.20%, below 0.30% consensus.
Reuters reported that June PCE inflation slowed to 3.7% year over year from 4.1%, while core PCE rose 0.1% on the month and 3.3% year over year. The same report cautioned that Middle East-driven oil pressure could reverse some of that improvement.
Labor data remains too firm to give bonds a clean growth-scare catalyst. Initial claims rose to 197K, but that was below expectations, and continuing claims fell to 1.782M. Reuters noted that claims remained consistent with a stable labor market despite slower hiring.
Today’s calendar includes:
| Time | Release | Consensus | Prior |
| 8:30 a.m. | Employment Cost Index Q/Q | +0.80% | +0.90% |
| 8:30 a.m. | Employment Cost Index Y/Y | +3.3% | +3.4% |
| 9:45 a.m. | Chicago PMI | 56.0 | 56.7 |
| 10:00 a.m. | Michigan Sentiment, final | 54.4 | 54.4 prelim. |
For bonds, ECI matters most. A softer wage-cost print would support the front-end rally and intermediate duration. A firm ECI would keep the Fed’s inflation concern alive and make it harder for the long end to stabilize.
ETF Flow Leaders
| ETF | Segment | 1W Return | 1W Flows | 1M Flows |
| SGOV | Ultra-Short Treasuries | +0.05% | +$845M | +$4.30B |
| VTEB | Municipal Bonds | +0.08% | +$657M | +$676M |
| BND | Broad Market Bonds | +0.15% | +$391M | +$3.70B |
| JPST | Ultra-Short Active | +0.12% | +$315M | +$1.15B |
| USFR | Floating-Rate Treasuries | +0.06% | +$264M | +$594M |
| VTIP | Short-Term TIPS | +0.14% | +$242M | +$684M |
| BNDX | Global Bonds | +0.17% | +$211M | +$815M |
| VGSH | Short Treasuries | 0.00% | +$203M | +$895M |
| MUB | Municipal Bonds | +0.20% | +$201M | +$308M |
| BSV | Short-Term Bonds | +0.22% | +$194M | +$1.04B |
The flow signal is constructive but defensive. SGOV, JPST, USFR, VGSH, and BSV show demand for cash management and short-duration ballast. VTEB and MUB show municipal demand remains strong. VTIP continues to attract flows as investors keep targeted inflation protection in the mix.
The caution is the long end. TLT saw $663M of weekly outflows despite still showing $2.37B of one-month inflows. BKLN lost $221M, while IEI and SHY also posted notable weekly outflows.
Trading Implications
Core bonds: Maintain exposure. Broad bond ETFs are still attracting assets, but returns remain constrained by the long end.
Duration: Favor short and intermediate duration over a full long-duration overweight. The 30-year Treasury above 5.20% and TLT outflows argue for keeping long Treasuries tactical.
Credit: Be selective. IG spreads remain contained, but spread widening over the month argues against adding aggressively to longer-duration credit.
High yield: Stay cautious. HY spreads are not yet stressed, but they have widened over the week and remain vulnerable if growth slows or oil volatility returns.
Cash management: Keep ultrashort and floating-rate Treasury ETFs in the allocation mix. SGOV, JPST, USFR, VGSH, and BSV are all flow leaders.
Munis: Maintain tax-aware municipal exposure. VTEB and MUB were among the strongest flow leaders, though duration should still be managed carefully.
TIPS: Favor short-term TIPS over broad long-duration inflation exposure. VTIP flows remain constructive, and breakevens are still contained despite oil risk.
CLOs / loans: Senior floating-rate credit remains useful as a volatility buffer, but BKLN outflows show investor demand is uneven.
Bottom Line
The July 31 setup is more stable than the immediate post-Fed selloff, but the long end remains the key constraint. Front-end yields have eased, PCE data improved, and oil is off last week’s highs. However, the 30-year Treasury is still above 5.20%, real yields remain elevated, and rates volatility is still high. ETF flows favor cash management, munis, short TIPS, short-duration bonds, and core exposure. Keep long Treasuries and longer-duration credit tactical until the long end stabilizes.
Sources
- FactSet Research Systems Inc., ETFFixedIncome.com Fund Universe Return & Flow Database, July 31, 2026
- FactSet Research Systems Inc., July 31 rates, credit, volatility, commodity, FX, and economic calendar data
- Reuters reporting on the Fed, bond-market reaction, PCE inflation, jobless claims, oil prices, and U.S.-Iran conflict risk
- CME Group / New York Fed reference materials on fed funds futures methodology
Disclaimer: This commentary is for informational and educational purposes only and should not be considered investment advice. ETF return and flow data can change quickly and may reflect short-term trading activity rather than durable allocation trends. Fixed income investments are subject to interest-rate risk, credit risk, liquidity risk, inflation risk, liquidity risk, tax considerations, and potential loss of principal.