
As of: July 31, 2026 | Reference security: AGG
Model: ETFFixedIncome.com Income 10-Spot Model
July Review
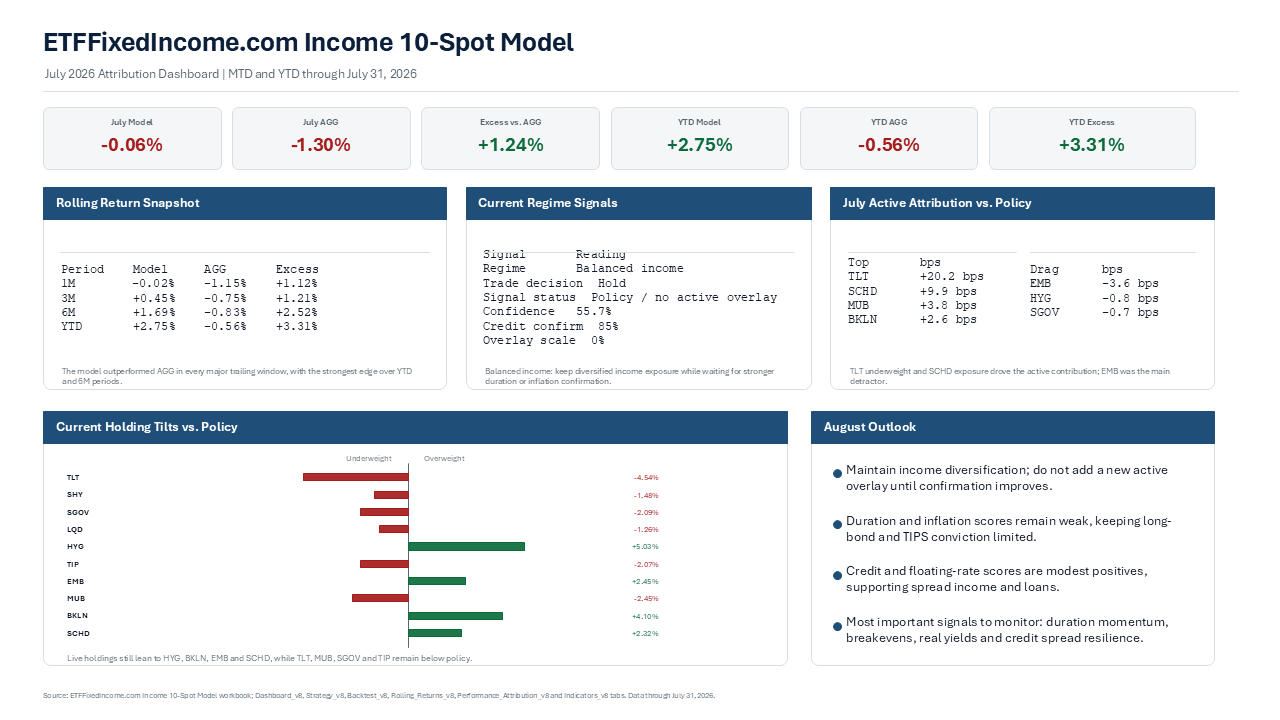
The Income 10-Spot Model was essentially flat in July, returning -0.06% versus AGG down -1.30%, producing +1.24% of excess return. The policy allocation also outperformed AGG by +0.89%, while the model’s active overlay added +0.35% versus policy.
The month rewarded the model’s lower exposure to broad duration and its diversified income structure. The largest July active contribution versus policy came from the TLT underweight, while SCHD, MUB, BKLN, LQD and TIP also added relative value. EMB was the largest detractor, and HYG, SGOV and SHY were small negatives.
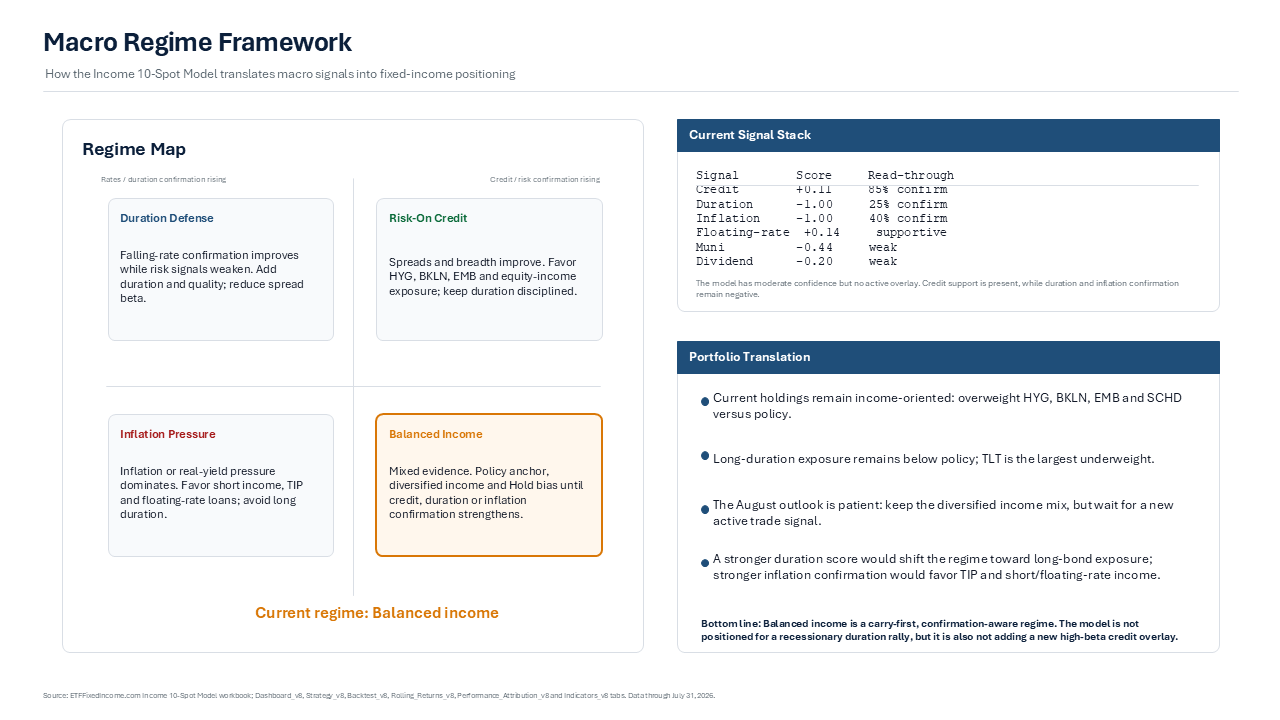
The current regime is Balanced income with a 55.7% confidence score. The model’s latest trade decision is Hold; its signal status is policy / no active overlay. That combination points to an income-focused but rate-risk cautious stance rather than a fresh high-conviction active trade.
Model Performance and Attribution
| Metric | July MTD Return or Active Contribution |
| Model July MTD return | -0.06% |
| Policy July MTD return | -0.41% |
| Benchmark: AGG July MTD return | -1.30% |
| Model excess vs. AGG | +1.24% |
| Model active return vs. policy | +0.35% |
| Policy excess vs. AGG | +0.89% |
Rolling Model Attribution vs. AGG
| Period | Attribution Window | Model Return | AGG Reference Return | Model Excess vs. AGG | Excess Return vs. AGG |
| 1D | Jul. 30 – Jul. 31 | -0.04% | -0.26% | +0.21% | +21 bps |
| 1W | Jul. 24 – Jul. 31 | +0.12% | -0.09% | +0.21% | +21 bps |
| 1M | Jul. 1 – Jul. 31 | -0.02% | -1.15% | +1.12% | +112 bps |
| 3M | Apr. 30 – Jul. 31 | +0.45% | -0.75% | +1.21% | +121 bps |
| 6M | Jan. 29 – Jul. 31 | +1.69% | -0.83% | +2.52% | +252 bps |
| YTD | Dec. 31 – Jul. 31 | +2.75% | -0.56% | +3.31% | +331 bps |
Security-Level Active Contribution vs. Policy
The table below shows each ETF’s contribution to active return versus the model’s policy allocation. These figures are active attribution effects; they should not be read as standalone ETF returns or as direct excess return versus AGG.
| ETF | July Active Contribution vs. Policy | YTD Active Contribution vs. Policy |
| TLT | +20.2 bps | +9.1 bps |
| SCHD | +9.9 bps | +26.6 bps |
| MUB | +3.8 bps | +2.2 bps |
| BKLN | +2.6 bps | +0.7 bps |
| LQD | +2.3 bps | +1.4 bps |
| TIP | +1.4 bps | +0.3 bps |
| SHY | -0.2 bps | -1.0 bps |
| SGOV | -0.7 bps | -4.2 bps |
| HYG | -0.8 bps | +0.4 bps |
| EMB | -3.6 bps | -0.5 bps |
July active attribution summed to approximately +35 bps, led by TLT (+20.2 bps), SCHD (+9.9 bps), MUB (+3.8 bps) and BKLN (+2.6 bps). EMB detracted -3.6 bps.
Current Positioning and Signal Read-Through
| Ticker | Policy Weight | Latest Model Holding | Active Tilt |
| TLT | 8.00% | 3.46% | -4.54% |
| SHY | 10.00% | 8.52% | -1.48% |
| SGOV | 15.00% | 12.91% | -2.09% |
| LQD | 20.00% | 18.74% | -1.26% |
| HYG | 12.00% | 17.03% | +5.03% |
| TIP | 10.00% | 7.93% | -2.07% |
| EMB | 5.00% | 7.45% | +2.45% |
| MUB | 5.00% | 2.55% | -2.45% |
| BKLN | 5.00% | 9.10% | +4.10% |
| SCHD | 10.00% | 12.32% | +2.32% |
The live holdings remain tilted toward HYG (+5.03%), BKLN (+4.10%), EMB (+2.45%) and SCHD (+2.32%). The largest underweights are TLT (-4.54%), MUB (-2.45%), SGOV (-2.09%) and TIP (-2.07%).
| Signal | Latest Reading |
| Regime | Balanced income |
| Trade decision | Hold |
| Signal status | Policy / no active overlay |
| Confidence score | 55.7% |
| Overlay scale | 0% |
| Credit score / confirmation | +0.11 / 85% |
| Duration score / confirmation | -1.00 / 25% |
| Inflation score / confirmation | -1.00 / 40% |
| Floating-rate score | +0.14 |
| Muni score | -0.44 |
| Dividend score | -0.20 |
August Outlook Based on Model Signals
The August setup remains balanced-income oriented. Credit confirmation is the strongest part of the signal stack, but the aggregate overlay is zero, so the model is not calling for a new active increase in risk. Existing holdings still lean toward spread income and floating-rate exposure, but the target signal has moved back to policy weight.
Duration remains the clearest caution. The Duration Score is -1.00, and long-duration Treasury exposure remains well below policy weight. That stance is consistent with a market in which falling-rate confirmation is not strong enough to justify a large TLT allocation. Inflation protection also lacks confirmation, with an Inflation Score of -1.00 and no effective inflation overlay.
The constructive side of the signal mix is income breadth. Credit, floating-rate, defensive and EM scores are modestly positive, which supports the model’s preference for diversified income rather than concentrated long-bond beta. Muni and dividend scores are negative, but the current holdings still retain SCHD exposure because the model is in hold mode rather than a full rebalance to policy.
For August, the model’s message is to maintain income diversification, avoid a large directional duration bet, and wait for stronger confirmation before adding a new active overlay. The most important confirmation signals would be improved duration momentum, stabilization in inflation inputs, and continued resilience in credit spreads.
Longer-Term Performance Snapshot
| Metric | Model | Policy | AGG |
| Since-inception annualized return | 3.34% | 2.88% | -0.08% |
| Annualized volatility | 4.87% | 5.22% | 5.65% |
| Sharpe ratio | 0.69 | 0.55 | -0.01 |
| Max drawdown | -12.79% | -14.81% | -18.44% |
| 1-year cumulative return | 5.99% | 5.59% | 2.77% |
| 3-year cumulative return | 17.84% | 16.94% | 11.20% |
| 5-year cumulative return | 10.91% | 9.33% | -1.77% |
Attribution Takeaways
The model beat AGG by +1.24% in July and by +3.31% year to date.
Most of July’s advantage versus AGG came from duration avoidance and diversified policy exposure; tactical active attribution versus policy added +35 bps.
The current signal stack is not aggressively risk-on. Balanced income, a 55.7% confidence score, Hold trade decision and 0% overlay scale all point to patience.
The biggest challenge is that duration and inflation signals remain weak at the same time. That reduces the appeal of both a conventional long-bond rally trade and a large inflation-hedging trade.
Methodology
- Trailing windows are measured through July 31, 2026.
- 1W = 5 trading days, 1M = 21 trading days, 3M = 63 trading days and 6M = 126 trading days.
- YTD is measured from the Dec. 31, 2025 close through July 31, 2026.
- July MTD is measured from the June 30, 2026 close through July 31, 2026.
- Security-level active attribution is calculated using each ETF’s daily active weight versus policy multiplied by its daily return.
- AGG is used as the reference return for model-level comparison. Model excess return equals model return minus AGG return.
- Contribution totals may differ slightly from compounded model returns because the table sums daily active return contributions while model returns are compounded over the full period.
Disclaimer: This report is for informational and educational purposes only and should not be considered investment advice or a recommendation to buy or sell any security. Model outputs, returns, signals and attribution can change as market data updates. Past performance does not guarantee future results.