The Lead
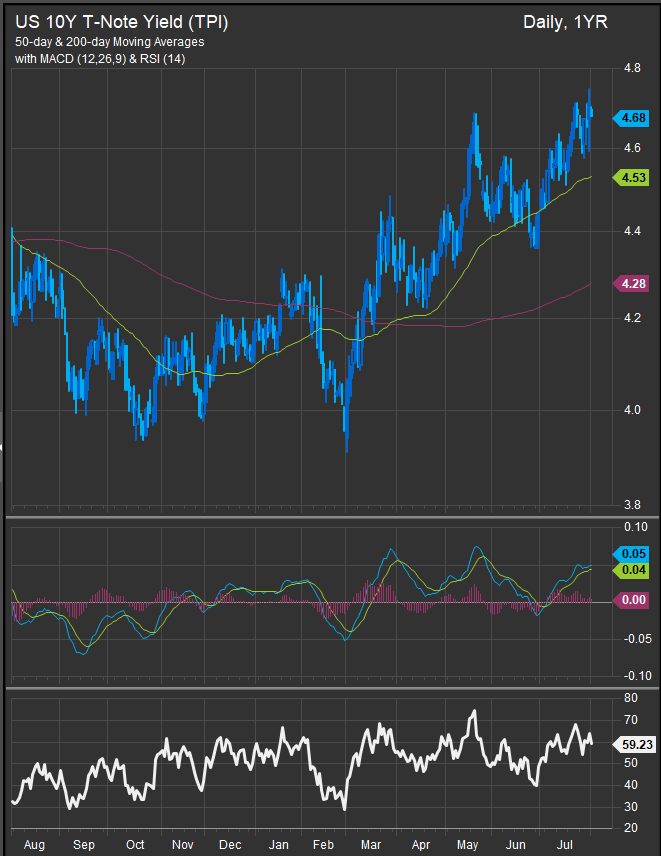
Fixed income starts August with the long end still under pressure. The 10-year Treasury rose to 4.71%, the 30-year Treasury moved to 5.25%, and the 10-year real yield climbed to 2.47%, all at the top of their one-year ranges. The front end also backed up slightly, with the 2-year Treasury at 4.27%.
Oil is providing some early relief. July 31 data showed WTI crude at $84.67, but Reuters reported Monday morning that WTI dropped to roughly $79.60 after President Trump called off a planned strike on Iran and sought a nuclear deal, easing some immediate energy-driven inflation pressure.
The setup still favors an income-oriented allocation: collecting yield from ultrashort, short-duration, municipal, short-credit, and selective investment-grade segments while keeping long-duration Treasury exposure tactical.
Rates Tape
| Rate | Latest | 1D Change | 1W Change |
| 2Y Treasury | 4.27% | +3.3 bp | -6.4 bp |
| 10Y Treasury | 4.71% | +4.8 bp | +3.1 bp |
| 30Y Treasury | 5.25% | +4.6 bp | +8.7 bp |
| 2s10s Curve | 44.4 bp | +1.5 bp | +9.5 bp |
| 5s30s Curve | 83.0 bp | +0.0 bp | +9.4 bp |
The curve remains the main story. The front end is lower over the past week, but the long end has continued to sell off. TLT fell 1.79% over the past week, VGLT fell 1.07%, EDV declined 3.24%, and ZROZ dropped 3.81%. Intermediate Treasuries held up better, with VGIT up 0.05% and IEF down 0.35% over the week.
Macro Signal Board
| Signal | Latest | 1D Change | 1W Change | 1Y Percentile | Trading Read |
| 10Y Treasury | 4.71% | +4.8 bp | +3.1 bp | 100th | Duration pressure is at a one-year extreme. |
| 30Y Treasury | 5.25% | +4.6 bp | +8.7 bp | 100th | Long-end risk remains the key pressure point. |
| 10Y Real Yield | 2.47% | +6.0 bp | +4.0 bp | 100th | Real yields remain the main duration headwind. |
| 10Y Breakeven | 2.28% | +1.0 bp | +2.0 bp | 35th | Inflation compensation is contained but rising. |
| Fed Funds Implied Rate | 3.63% | -0.5 bp | -9.0 bp | 10th | Front-end pricing is more dovish than last week. |
| IG OAS | 79 bp | -1 bp | -1 bp | 59th | IG credit stress remains contained. |
| HY OAS | 285 bp | +1 bp | +6 bp | 52nd | HY spreads have widened but are not stressed. |
| MOVE Index | 83.0 | +5.9 | +6.2 | 89th | Rates volatility is elevated. |
| WTI Crude | $84.67 | +$1.08 | -$4.64 | 72nd | Oil has eased from the shock but remains volatile. |
The Fed backdrop remains unresolved. Reuters reported Monday that New York Fed President John Williams expects inflation to ease, but said the Fed is prepared to act if inflation does not move toward target. He also defended the recent decision to hold the target range at 3.50%–3.75%.
Calendar Watch
Friday’s data leaned growth-positive and wage-sticky. The Employment Cost Index rose 0.90% versus 0.80% consensus, while Chicago PMI rose to 57.6 versus 55.0 consensus. Michigan Sentiment improved to 55.2 versus 54.4 consensus. That mix did not give bonds a clean growth-scare catalyst.
Today’s calendar focuses on manufacturing and construction:
| Time | Release | Consensus | Prior |
| 9:45 a.m. | S&P Global Manufacturing PMI, final | 54.2 | 53.8 prelim. |
| 10:00 a.m. | Construction Spending M/M | +0.20% | +0.10% |
| 10:00 a.m. | ISM Manufacturing | 54.1 | 53.3 |
The rest of the week includes trade balance, factory orders, and JOLTS on Tuesday, ADP and ISM Services on Wednesday, and the July Employment Situation on Friday. The official BLS calendar shows the August 2026 Employment Situation release scheduled for Friday, August 7 at 8:30 a.m. ET.
ETF Flow Leaders
| ETF | Segment | 1W Return | 1W Flows | 1M Flows |
| HYG | High Yield | +0.26% | +$1.22B | -$378M |
| PAVE | Infrastructure / Diversified | -1.95% | +$640M | +$598M |
| VTEB | Municipal Bonds | -0.18% | +$588M | +$701M |
| MUB | Municipal Bonds | -0.15% | +$496M | +$350M |
| BND | Broad Market Bonds | -0.32% | +$471M | +$3.84B |
| VCSH | Short IG Credit | +0.15% | +$370M | +$435M |
| VCIT | Intermediate IG Credit | -0.07% | +$326M | +$1.52B |
| IAGG | Global Aggregate Bonds | -0.16% | +$319M | +$657M |
| JPST | Ultra-Short Active | +0.10% | +$290M | +$1.24B |
| IGSB | Short IG Credit | +0.19% | +$287M | +$1.02B |
The flow signal remains constructive but has shifted. Municipal demand is strong, with VTEB and MUB both near the top of the weekly flow table. Short investment-grade credit is also attracting assets through VCSH and IGSB, while JPST, SGOV, and USFR show continued demand for cash-management exposure.
The caution is the long end. LQD saw $991M of weekly outflows, TLT lost $531M, IEI lost $349M, AGG lost $303M, and EMB lost $246M. HYG had a large weekly inflow, but its one-month flow remains negative, so the high-yield signal is not yet a broad risk-on confirmation.
Trading Implications
Core bonds: Maintain exposure, but expect returns to remain rate-sensitive while the 10-year and 30-year sit at one-year highs.
Duration: Favor short and intermediate duration over a full long-duration overweight. The 30-year Treasury at 5.25%, elevated MOVE, and TLT outflows argue for keeping long Treasuries tactical.
Credit: Prefer short and intermediate investment-grade exposure. VCSH, VCIT, and IGSB are attracting assets, while LQD outflows show pressure in longer-duration credit.
High yield: Stay selective. HYG had strong weekly inflows, but one-month flows are still negative and HY spreads have widened over the past week.
Cash management: Keep ultrashort and floating-rate Treasury ETFs in the allocation mix. JPST, SGOV, and USFR remain supported by flow demand.
Munis: Maintain tax-aware municipal exposure. VTEB and MUB are both flow leaders, though duration should still be managed carefully while long-end yields remain elevated.
TIPS: Favor short-term inflation protection over broad long-duration TIPS. VTIP continues to attract assets, and real yields remain restrictive.
CLOs / loans: Senior floating-rate credit remains useful as a volatility buffer, but BKLN outflows show investor demand is uneven.
Bottom Line
The August 3 setup remains difficult for long duration. The 10-year, 30-year, and 10-year real yield are all at one-year highs, while rate volatility is elevated. Oil relief helps at the margin, and front-end Fed pricing is more dovish, but wage and manufacturing data have not provided a clean growth-scare catalyst. ETF flows favor munis, short investment-grade credit, cash-management exposure, and broad bonds. Keep long Treasuries and longer-duration credit tactical until the long end stabilizes.
Sources
- FactSet Research Systems Inc., ETFFixedIncome.com Fund Universe Return & Flow Database, August 3, 2026
- FactSet Research Systems Inc., August 3 rates, credit, volatility, commodity, FX, and economic calendar data
- Reuters reporting on oil, Iran-related geopolitical risk, Fed policy commentary, and market conditions
- U.S. Bureau of Labor Statistics release calendar
- CME Group / New York Fed reference materials on fed funds futures methodology
Disclaimer: This commentary is for informational and educational purposes only and should not be considered investment advice. ETF return and flow data can change quickly and may reflect short-term trading activity rather than durable allocation trends. Fixed income investments are subject to interest-rate risk, credit risk, liquidity risk, inflation risk, tax considerations, and potential loss of principal.