
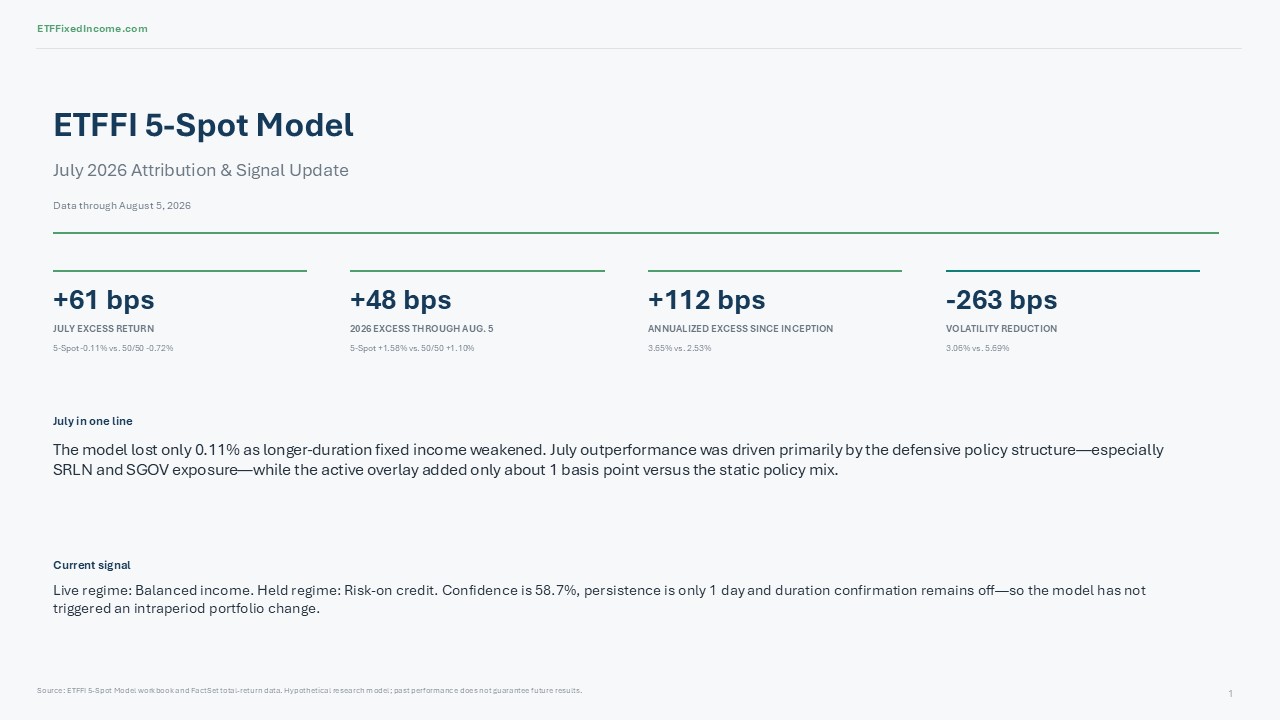
Data through August 5, 2026
July Attribution
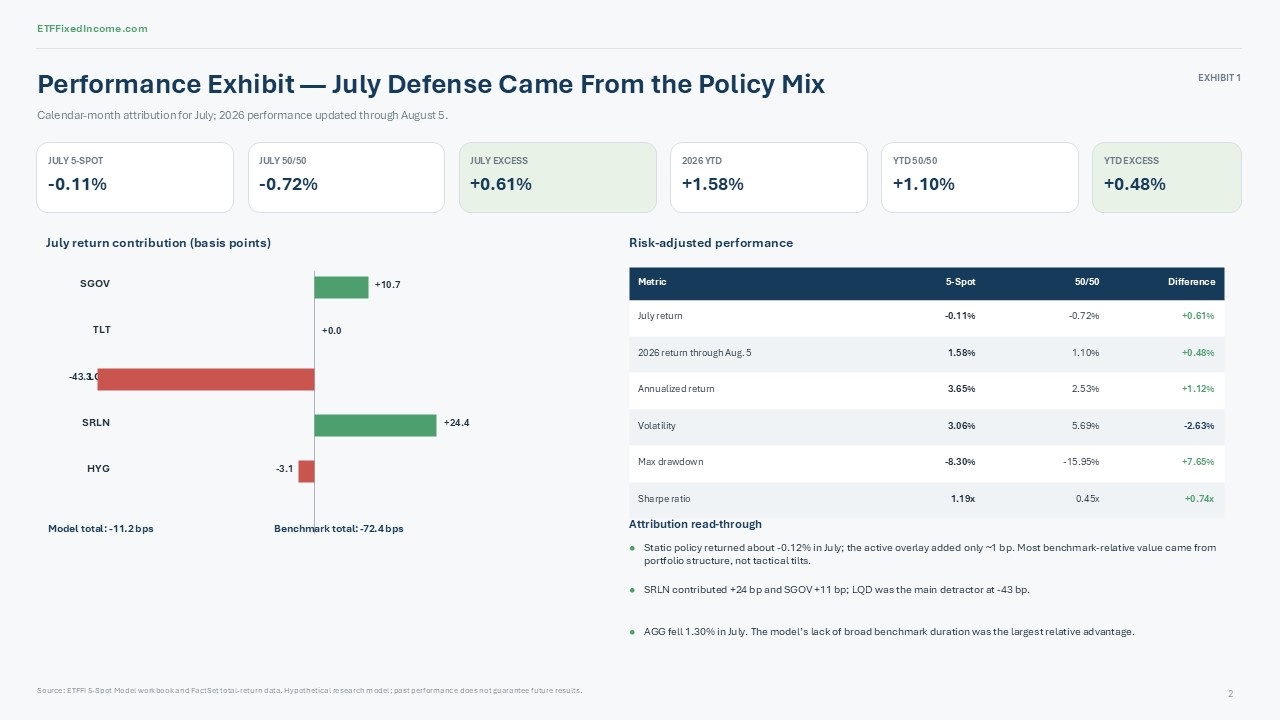
The ETFFI 5-Spot Model held up well during a difficult July for traditional fixed income. The model returned -0.11%, compared with -0.72% for the quarterly rebalanced 50% AGG / 50% HYG benchmark, generating approximately 61 basis points of excess return.
The important attribution point is that July’s advantage came primarily from portfolio construction rather than the active overlay. The Static Policy Mix returned approximately -0.12%, meaning the active overlay added only about 1 basis point during the month. The model benefited chiefly from maintaining substantially less duration exposure than the benchmark.
At the sleeve level, SRLN was the strongest contributor, adding roughly 24 basis points, as floating-rate loans gained 0.85% during July. SGOV added approximately 11 basis points, providing both positive carry and stability. LQD was the principal detractor, subtracting roughly 43 basis points as investment-grade bonds declined 2.24%. HYG detracted approximately 3 basis points, while the model held no TLT.
That positioning was particularly valuable because AGG declined 1.30% in July. The benchmark’s 50% AGG allocation was therefore a much larger drag than anything in the 5-Spot portfolio. In short, July’s outperformance was primarily the result of the model’s short-duration, floating-rate-oriented policy structure.
Through August 5, the model is up 1.58% in 2026, versus 1.10% for the 50/50 benchmark, maintaining a 48-basis-point YTD advantage. The Static Policy Mix is also up approximately 1.58%, reinforcing the conclusion that 2026 excess return has so far been largely structural rather than driven by tactical overlay decisions. Since inception, however, the active model has produced a 3.65% annualized return versus 2.53% for the benchmark, with lower volatility of 3.06% versus 5.69%, a substantially shallower maximum drawdown of -8.30% versus -15.95%, and a higher Sharpe ratio of 1.19 versus 0.45.
Current Signal Update
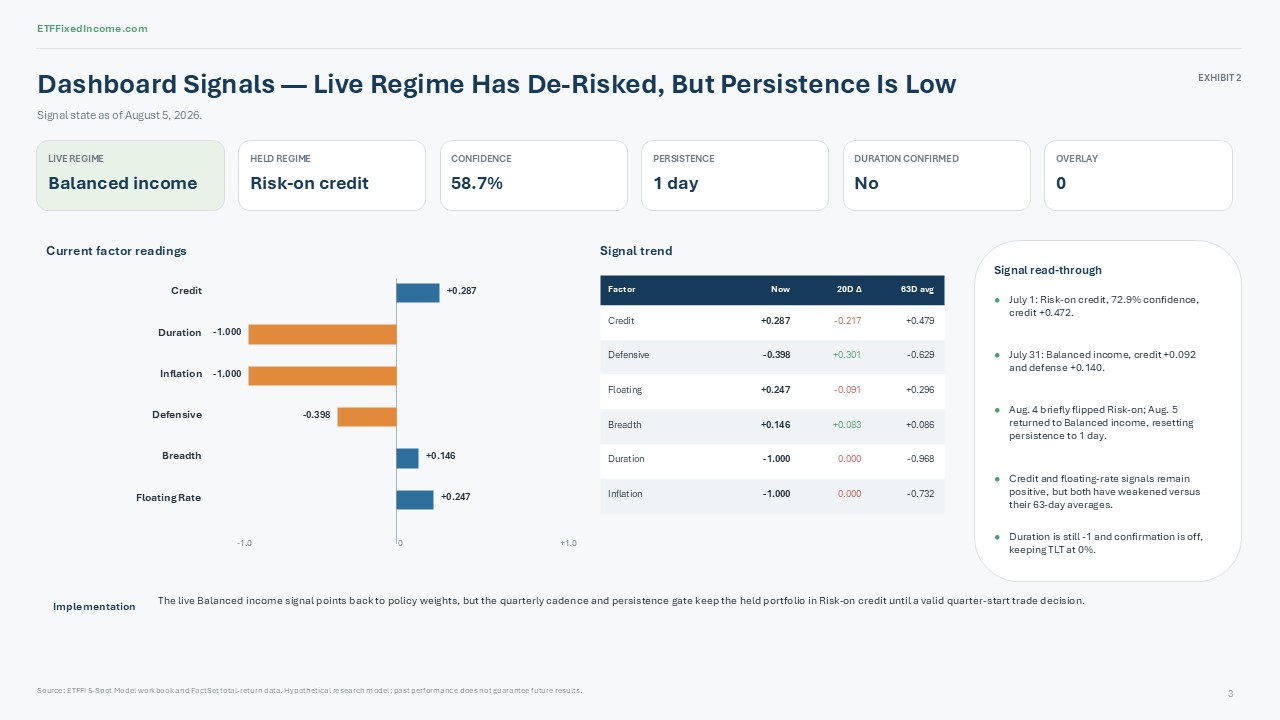
The live model regime has shifted to Balanced income, with 58.7% confidence and an overlay reading of zero. The portfolio nevertheless remains in its previously implemented Risk-on credit regime because the model trades only at quarter starts and the current signal has just one day of persistence. Duration confirmation also remains off.
The underlying signals show a meaningful cooling in risk appetite. Credit remains positive at +0.287, but has fallen 0.217 over the past 20 days and remains well below its 63-day average of +0.479. The floating-rate signal remains positive at +0.247, but has also weakened. Breadth is modestly supportive at +0.146, while the defensive reading has risen materially over the past month even though it remains negative at -0.398. Duration and inflation readings remain at -1.0.
The change is notable relative to July 1, when the model was firmly Risk-on credit, with 72.9% confidence and a +0.472 credit reading. By July 31, the regime had shifted to Balanced income as credit weakened and defensive signals strengthened. A brief return to Risk-on credit on August 4 reversed again on August 5, preventing the persistence requirement from being met.
Current Positioning
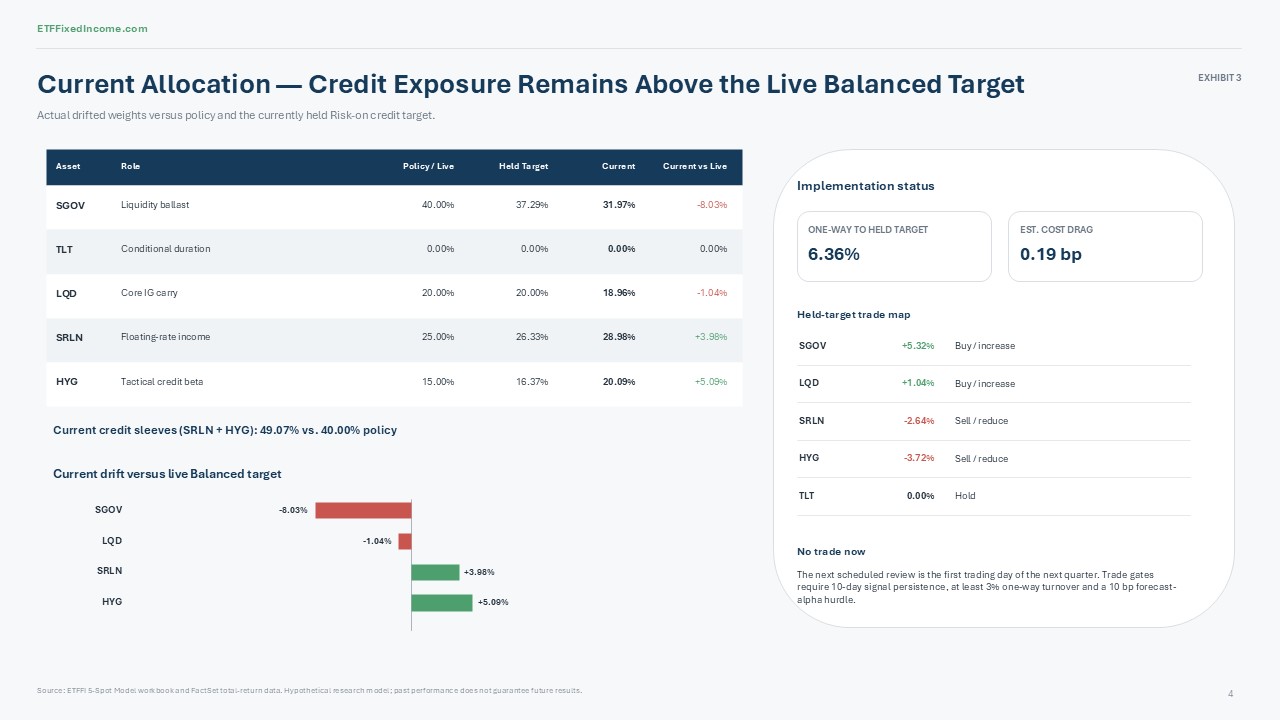
The actual portfolio is currently 31.97% SGOV, 0% TLT, 18.96% LQD, 28.98% SRLN and 20.09% HYG. Combined SRLN and HYG exposure is therefore 49.07%, versus a 40% policy weight.
The live Balanced income signal points back toward the 40% SGOV / 20% LQD / 25% SRLN / 15% HYG policy mix, but no immediate trade is indicated. The currently held Risk-on credit target would require 6.36% one-way turnover, principally adding SGOV and LQD while reducing SRLN and HYG.
Bottom line: July demonstrated the value of the 5-Spot model’s low-duration policy architecture. The current signals are becoming more neutral, but implementation remains credit-oriented until the quarterly trade gates are satisfied.