
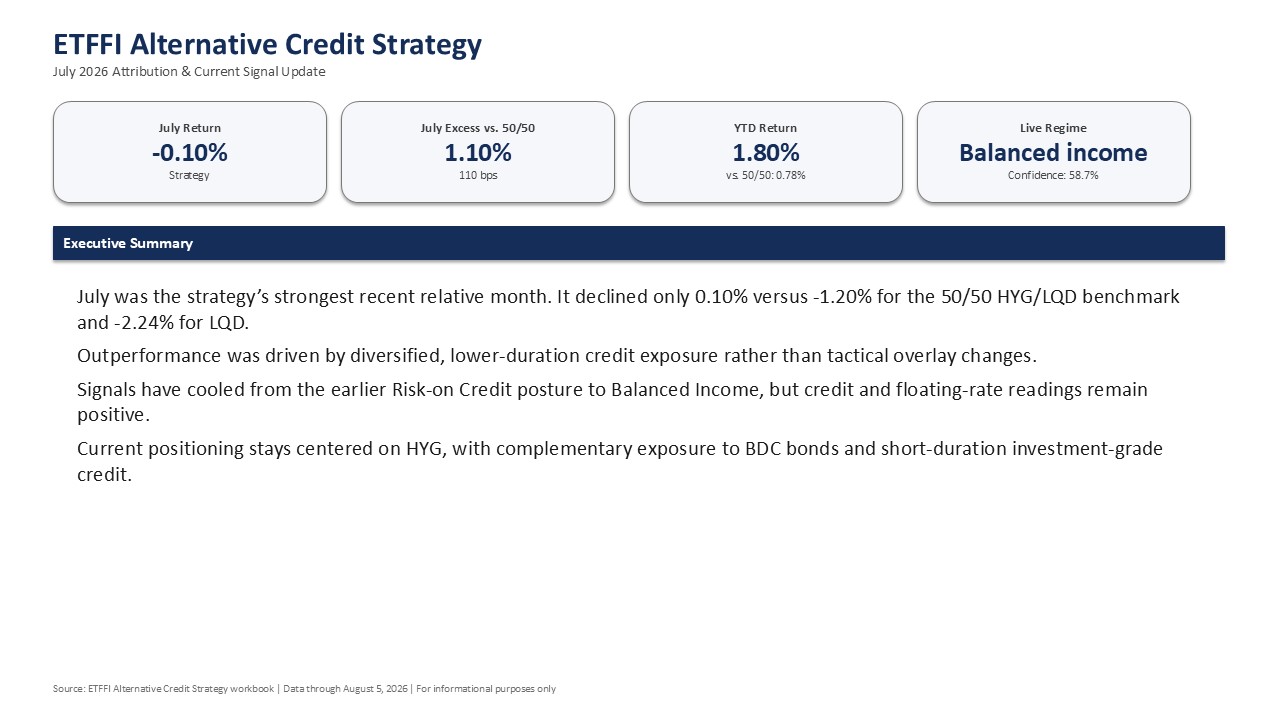
The ETFFI Alternative Credit Strategy showed its strongest relative advantage in July, when weakness in longer-duration corporate bonds created a difficult backdrop for conventional credit portfolios. The strategy declined just 0.10%, compared with -1.20% for the quarterly rebalanced 50% HYG / 50% LQD benchmark and -2.24% for LQD. That produced approximately 110 basis points of excess return versus the primary benchmark and 214 basis points versus investment-grade corporates.
The key driver was portfolio structure rather than tactical trading. The strategy remained in its Balanced Income allocation throughout the month, with 65% in HYG and the remainder distributed across specialty, BBB and short-duration credit exposures. Avoiding a large allocation to longer-duration LQD was particularly valuable: LQD accounted for approximately 112 basis points of the 50/50 benchmark’s July loss.
Within the strategy, HYG was the largest detractor, contributing roughly -10 basis points as high yield slipped 0.15%. HBDC and SHY were the primary positive contributors, while the short-duration investment-grade sleeves were generally close to flat.
| July Attribution | Return / Contribution |
| ETFFI Alternative Credit Strategy | -0.10% |
| 50% HYG / 50% LQD | -1.20% |
| LQD | -2.24% |
| Excess vs. 50/50 | +1.10% |
| HYG contribution | -0.10% |
| HBDC contribution | +0.02% |
| SHY contribution | +0.00% |
| Other credit sleeves | Approximately flat |
July therefore reinforced the strategy’s core proposition: diversified credit income with substantially less duration exposure than a traditional HYG/LQD allocation.
2026 Performance Trend
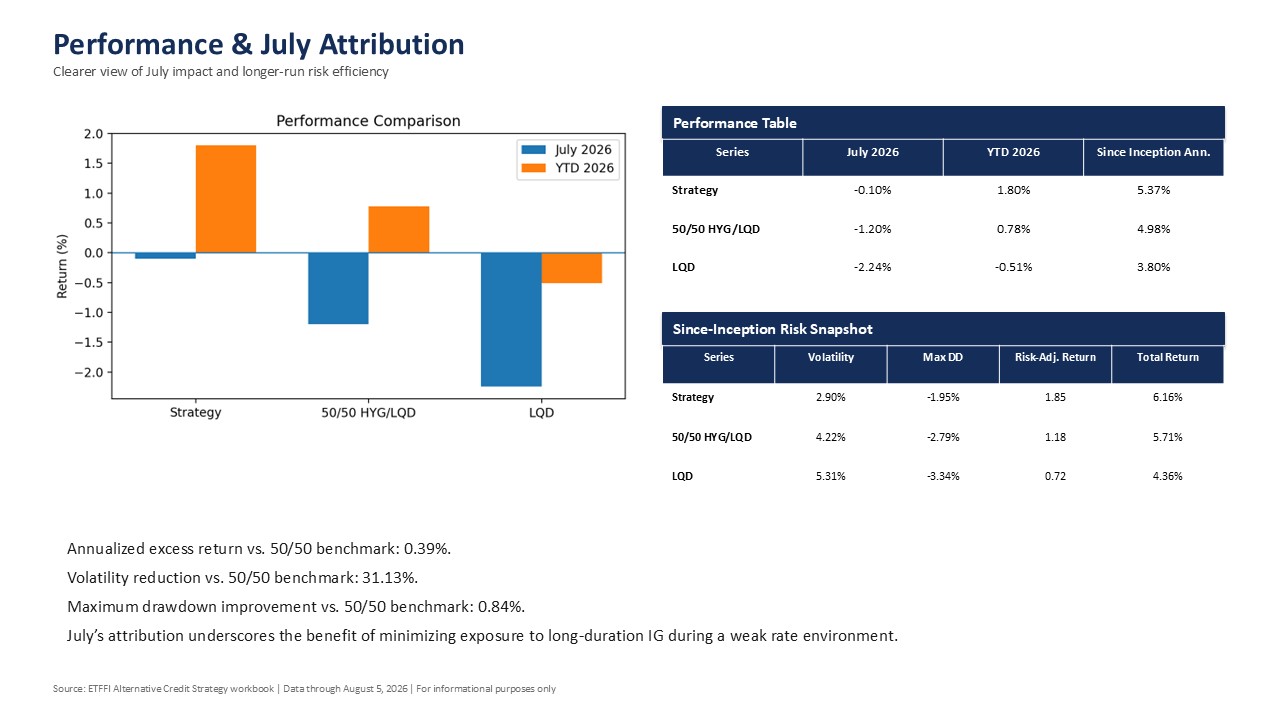
Through August 5, the strategy has returned 1.80% YTD, compared with 0.78% for the 50/50 benchmark and -0.51% for LQD. The advantage widened materially during July as rising yields pressured investment-grade corporate bonds.
Since the actual-fund backtest began on June 12, 2025, the strategy has produced a 5.37% annualized return, versus 4.98% for the primary benchmark. More important has been the improvement in risk efficiency: annualized volatility is 2.90% versus 4.22%, while maximum drawdown is -1.95% versus -2.79%. The strategy’s risk-adjusted return of 1.85 also compares favorably with 1.18 for the benchmark.
The performance record supports viewing Alternative Credit primarily as a risk-efficient credit-income allocation, rather than a high-turnover alpha strategy.
Current Signal Update
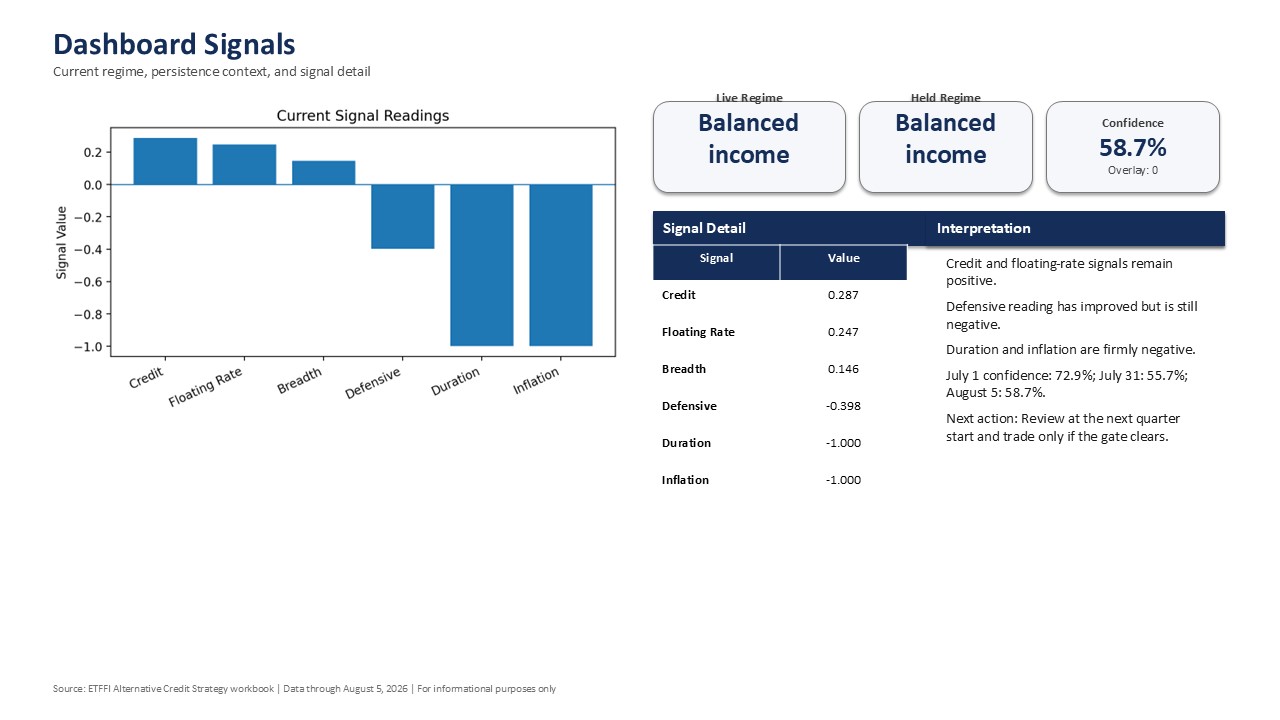
The live signal is now Balanced Income, with 58.7% confidence and a neutral overlay. This represents a moderation from July 1, when the model was signaling Risk-on Credit with 72.9% confidence.
The underlying signals show that credit conditions remain constructive, but conviction has weakened:
- Credit: +0.287 — positive, but below early-July levels.
- Floating Rate: +0.247 — still supportive of lower-duration credit.
- Breadth: +0.146 — modestly positive.
- Defensive: -0.398 — improved substantially from early July.
- Duration: -1.000.
- Inflation: -1.000.
The signal briefly returned to Risk-on Credit on August 4 before shifting back to Balanced Income on August 5. That instability reinforces the model’s persistence discipline rather than arguing for an immediate allocation change.
Current Allocation
| ETF | Weight | Role |
| HYG | 65% | Core high-yield income |
| HBDC | 10% | BDC-issued corporate credit |
| BBBS | 8% | Short-maturity BBB credit |
| PRSD | 5% | Public/private short-duration credit |
| VCSH | 4% | Short-term corporate credit |
| IGSB | 3% | Short investment-grade credit |
| SLQD | 3% | Low-duration investment-grade credit |
| SHY | 2% | Treasury reserve |
Bottom line: July demonstrated the strategy’s main advantage. It did not avoid credit risk, but its diversified, short-duration construction substantially reduced the damage from the selloff in traditional investment-grade bonds. Current signals have cooled from Risk-on Credit to Balanced Income, supporting maintenance of the existing allocation rather than a new tactical trade.