
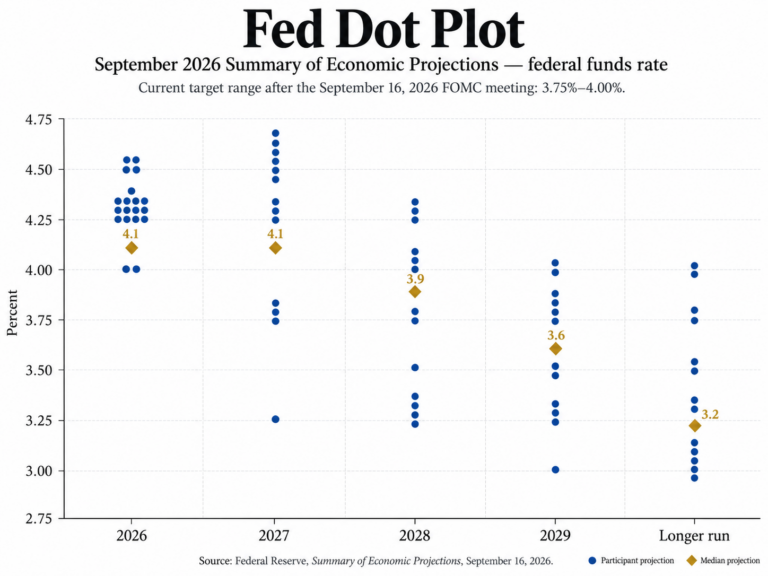
Thursday’s Treasury rally improves the duration setup, but 2.61% real yields, another Fed hike in the dot plot and synchronized global tightening keep long bonds tactical.
The Lead
Treasuries staged their strongest rally of the week Thursday, pulling the 10-year yield back to 4.934% after briefly moving above 5% earlier in the week. The 2-year fell 5.8 bps to 4.672%, the 10-year declined 8.0 bps, and the 30-year fell 6.8 bps to 5.287%. The move leaves the 10-year slightly below where it stood one week ago even as the 2-year remains roughly 11 bps higher, underscoring how the Fed’s hawkish shift has concentrated pressure at the front end.
Two forces helped the long end stabilize. Oil continued to retreat from Tuesday’s highs as Saudi Arabia found alternative export routes, and investors reassessed how much additional tightening the Fed can ultimately deliver without materially slowing growth. WTI settled Thursday at $101.91 and is near $101.30 this morning, while Brent has fallen toward $103. Supply risks remain elevated, but the immediate inflation shock has moderated.
The Fed nevertheless remains a constraint on a full-duration call. Wednesday’s 25 bp hike to 3.75%–4.00% was unanimous, and the September projections show most policymakers expecting additional tightening. The median 2026 policy-rate projection is 4.125%, effectively embedding one more quarter-point increase.
Preferred positioning remains an income-oriented allocation—collecting yield from lower-volatility bond segments rather than relying on a sharp decline in Treasury rates to drive total return. Long Treasury valuations are becoming more compelling, but ultrashort Treasuries, core bonds, munis and high-quality floating-rate credit remain the cleaner exposures while the market determines whether Thursday’s rally is durable.
Rates Tape
| Market | Latest | 1D Change | 1W Change |
| 2Y Treasury | 4.672% | -5.8 bps | +10.7 bps |
| 10Y Treasury | 4.934% | -8.0 bps | -1.5 bps |
| 30Y Treasury | 5.287% | -6.8 bps | -7.4 bps |
| 2s10s Curve | +26.3 bps | -2.2 bps | -12.2 bps |
| 5s30s Curve | +49.9 bps | +1.3 bps | -11.9 bps |
The rally translated directly into duration ETF performance. TLT gained 1.11% Thursday, while VGLT rose 1.06%, EDV gained 1.55% and ZROZ surged 1.83%. IEF gained 0.57%. The stronger performance of the longest-duration exposures reflects the rally in real and nominal long rates rather than an easing of Fed expectations at the front end.
Macro Signal Board
| Signal | Latest | 1D | 1W | 1Y Pctl. | Trading Read |
| 10Y Treasury | 4.934% | -8.0 bps | -1.5 bps | 98th | 5% resistance holding for now |
| 30Y Treasury | 5.287% | -6.8 bps | -7.4 bps | 97th | Long-end valuation improving |
| 10Y Real Yield | 2.61% | -7 bps | +6 bps | 99th | Still historically restrictive |
| 10Y Breakeven | 2.33% | Flat | -7 bps | 62nd | Energy inflation premium easing |
| Fed Funds Implied Rate | 3.90% | Flat | +7.5 bps | 89th | Additional tightening remains priced |
| IG OAS | 78 bps | Flat | -2 bps | 43rd | Limited credit cushion |
| HY OAS | 270 bps | Flat | Flat | 16th | Spreads remain unusually tight |
| MOVE | 76.2 | -4.5 | -5.9 | 72nd | Rate volatility cooling |
| WTI Crude | $101.91 | -$0.52 | -$0.57 | 94th | Still high, but immediate pressure easing |
The most constructive change is the combination of lower nominal yields, lower real yields and declining MOVE volatility. That improves the risk/reward for duration at the margin. The restraint is valuation in credit: IG and HY spreads remain tight even after a volatile week, meaning Treasury duration offers more obvious value than adding comparable corporate duration.
Calendar Watch
Thursday’s data showed a resilient labor market but continued housing weakness. Initial jobless claims fell to 196,000 from 206,000, versus 206,000 expected, while continuing claims declined to 1.730 million. The four-week average of initial claims also moved lower, reinforcing evidence that layoffs remain contained.
Housing was softer. August housing starts fell 2.6% to a 1.275 million annual rate, below the 1.318 million consensus in the September 18 data, while permits declined to 1.394 million. Single-family starts actually increased 7.6%, but multifamily activity fell sharply.
The Philadelphia Fed index remained expansionary at 37.8 versus 32.1 expected, while pending home sales rose only 0.3% M/M versus 0.5% consensus.
| Time | Release | Consensus | Prior |
| 9:15 a.m. | Industrial Production M/M | +0.30% | +0.20% |
| 9:15 a.m. | Manufacturing Production M/M | +0.20% | +0.16% |
| 9:15 a.m. | Capacity Utilization | 76.4% | 76.3% |
| 9:30 a.m. | Fed Vice Chair Bowman speaks on stress testing | — | — |
| 10:00 a.m. | Leading Indicators M/M | +0.10% | +0.20% |
Industrial production is the key domestic release. A stronger-than-expected print would reinforce the Fed’s upgraded growth assessment and could push yields back toward their recent highs. A softer number would support the argument that tighter financial conditions are beginning to restrain activity.
Global policy also remains relevant. The Bank of Japan raised its policy rate to 1.25% Friday, the highest in 31 years. U.S. 10-year yields remain near 4.93% despite that additional global tightening, but synchronized central-bank hikes remain a potential source of renewed bond volatility.
ETF Flow Leaders
| ETF | Segment | 1W Return | 1W Flows | 1M Flows |
| SGOV | Ultrashort Treasury | +0.04% | +$1.62B | +$7.24B |
| VTEB | Municipal Bonds | -0.08% | +$1.35B | +$1.58B |
| TLT | Long Treasury | +1.13% | +$685M | +$2.09B |
| MUB | Municipal Bonds | -0.01% | +$678M | +$637M |
| IEF | 7–10Y Treasury | +0.26% | +$473M | -$36M |
| IUSB | Broad Market | +0.31% | +$443M | +$1.06B |
| AGG | Broad Market | +0.36% | +$365M | +$1.40B |
| BND | Broad Market | +0.35% | +$349M | +$2.97B |
The flow picture has broadened beyond the cash-versus-duration barbell. SGOV still leads with more than $1.6 billion in weekly inflows and $7.2 billion over one month, but municipal demand has accelerated sharply. VTEB has attracted $1.35 billion over one week, while MUB added $678 million, suggesting investors are using higher tax-exempt yields to add exposure despite weak trailing returns.
Treasury duration is also still attracting buyers. TLT has gathered $685 million over the week and more than $2.0 billion over one month, while IEF added $473 million. Thursday’s rally suggests that some of that dip-buying is beginning to work as the 10-year retreats from 5%.
Corporate credit remains the notable exception. LQD lost $1.16 billion over one week and $5.08 billion over one month, while HYG lost $253 million for the week and $2.81 billion over one month. By contrast, JAAA continues to draw demand, with roughly $119 million of weekly inflows and $989 million over one month.
Trading Implications
- Core bonds: The rally and higher starting yields improve the setup for BND, AGG and IUSB. Add incrementally rather than waiting for a full Fed pivot; current yields provide more income cushion than earlier in the year.
- Duration: The break back below 5% in the 10-year is constructive, and TLT/EDV/ZROZ are beginning to respond. Keep long duration tactical, however, while the 10-year real yield remains 2.61% and the Fed continues to signal another potential hike.
- Credit: Favor shorter investment-grade exposure and securitized credit over LQD-style long corporate duration. Treasury yields have repriced much more than corporate spreads, leaving relatively little spread compensation.
- High yield: Stay selective. HY OAS remains only 270 bps, near the tight end of its one-year range, while HYG continues to see net redemptions despite Thursday’s positive return.
- Cash management: SGOV and similar ultrashort Treasury exposures remain attractive. The Fed hike has lifted short-rate income while preserving liquidity if longer-duration yields back up again.
- Munis: This is the clearest improvement in the flow tape. Strong VTEB and MUB inflows suggest investors are responding to higher tax-exempt yields. Favor short/intermediate municipal exposure while retaining discipline on the long end.
- TIPS / inflation hedges: Falling crude and breakevens reduce the urgency to add inflation protection aggressively, but real yields remain compelling and geopolitical risk persists. VTIP has attracted about $57M over one week and $715M over one month.
- CLOs / loans: JAAA remains attractive for investors seeking income without substantial duration. One-month flows near $1 billion reinforce demand for senior floating-rate credit as the Fed maintains a tightening bias.
Bottom Line
Thursday’s Treasury rally materially improved the fixed income setup, but it does not yet amount to an all-clear for duration. The 10-year is back near 4.93%, real yields have eased to 2.61% and oil is retreating, while bond volatility is moving lower. At the same time, the Fed has signaled another potential hike and credit spreads remain tight. Favor high-quality income, selectively add core bonds and munis, and use long Treasuries tactically rather than making a broad duration overweight.
Sources
- FactSet Research Systems Inc., ETFFixedIncome.com Fund Universe Return & Flow Database, September 18, 2026.
- FactSet Research Systems Inc., September 18, 2026 rates, credit, volatility, commodity, FX and economic-calendar data.
- Federal Reserve Board, September 16, 2026 FOMC statement.
- Federal Reserve Board, September 2026 Summary of Economic Projections.
- U.S. Department of Labor, September 17, 2026 Unemployment Insurance Weekly Claims.
- U.S. Census Bureau, August 2026 New Residential Construction.
- Reuters, September 18, 2026, global markets, Treasury yields and central-bank developments.
- Reuters, September 18, 2026, crude-oil supply and Saudi export developments.
Disclaimer: This commentary is for informational and educational purposes only and should not be considered investment advice. ETF return and flow data can change quickly and may reflect short-term trading activity rather than durable allocation trends. Fixed income investments are subject to interest-rate risk, credit risk, liquidity risk, inflation risk, tax considerations, and potential loss of principal.
