
As of: July 8, 2026
Reference security: AGG
Model: ETFFixedIncome.com Income 10-Spot Model
The Income 10-Spot Model has outperformed its reference security, AGG, across each of the standard trailing return windows. The strongest relative results came over the 3M, 6M, and YTD periods, where the model’s income-oriented positioning, lower long-duration exposure, and allocation to SCHD, HYG, EMB, and SGOV helped offset weakness in the broad bond benchmark.
Market Recap:
The fixed income backdrop remains challenging for broad bond exposure. Treasury yields remain elevated, while the Federal Reserve kept the federal funds target range at 3.50%–3.75% at its June 17 meeting and continued to describe inflation as above its 2% objective.
Credit has been more supportive than duration. The model’s recent results reflect that distinction: AGG has struggled across several trailing windows, while the Income 10-Spot Model has benefited from a more diversified income mix that includes short-duration income, high yield, floating-rate loans, emerging-market debt, and dividend income.
Outlook View Based on Current Model Signals
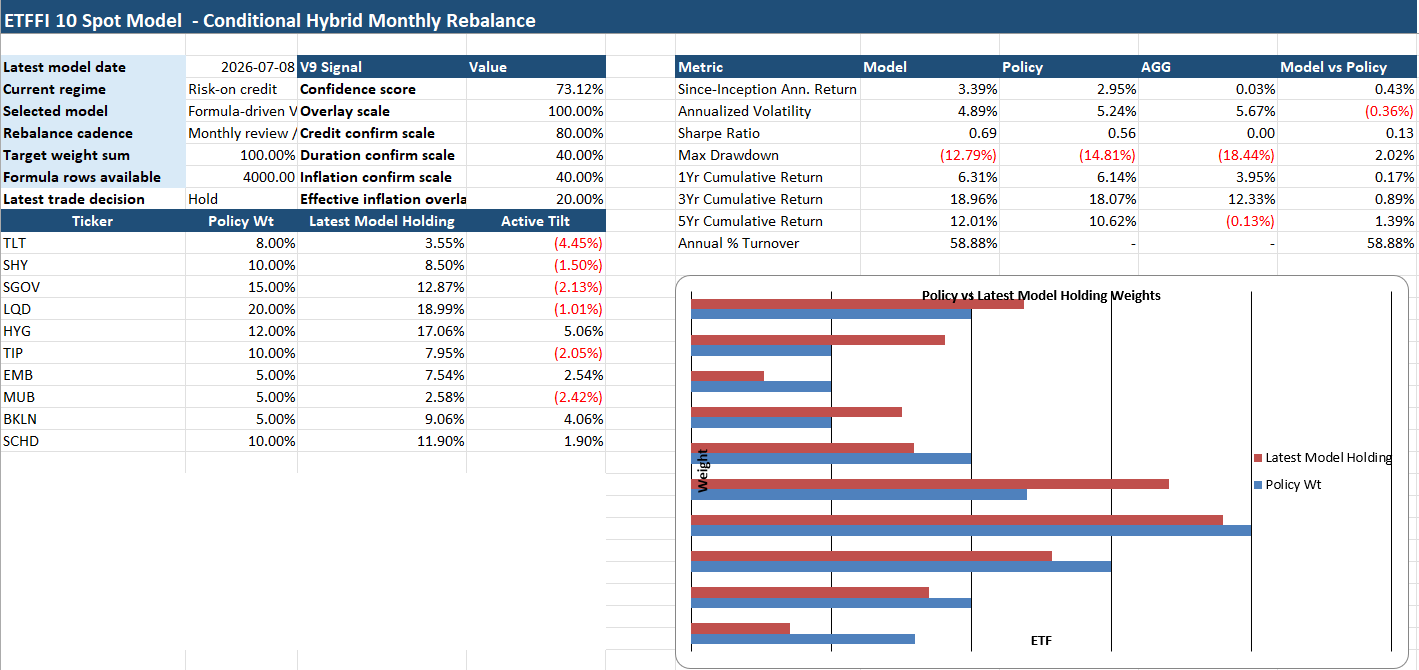
The model’s current signal mix remains income-focused but rate-risk cautious. The latest regime is Risk-on credit, with a 73.1% confidence score, a 100% active overlay, and a current trade decision of Hold after the July 1 target-change rebalance.
The strongest positive signal is credit. The model’s Credit Score is +0.50, which supports the overweight to HYG and the broader preference for spread income. Floating-rate loans and emerging-market debt also remain supported, with positive scores for BKLN and EMB.
The weakest signals are duration and inflation. The Duration Score is -1.00, which keeps TLT underweight, while the Inflation Score is -1.00 and the effective inflation overlay is only 20%, keeping TIP below policy weight. The model is not saying long bonds or inflation protection cannot work later in the summer; it is saying the evidence is not strong enough yet.
The July outlook remains straightforward: stay with income-producing credit exposure where the model sees confirmation, but do not make a large bet on falling interest rates until duration signals improve.
Rolling Model Attribution vs. AGG
| Period | Attribution Window | Model Return | AGG Reference Return | Model Excess vs. AGG |
| 1D | Jul. 7 – Jul. 8 | -0.17% | -0.17% | +0.00% |
| 1W | Jun. 30 – Jul. 8 | -0.03% | -0.62% | +0.59% |
| 1M | Jun. 5 – Jul. 8 | +0.36% | +0.20% | +0.15% |
| 3M | Apr. 7 – Jul. 8 | +1.29% | -0.14% | +1.43% |
| 6M | Jan. 5 – Jul. 8 | +2.41% | -0.04% | +2.45% |
| YTD | Dec. 31 – Jul. 8 | +2.78% | +0.12% | +2.66% |
Security-Level Contribution
The table below shows each ETF’s contribution to the model’s return in basis points. These figures are portfolio return contributions, calculated from the model’s daily beginning weight in each ETF and that ETF’s daily return. They are not meant to show each ETF’s excess return versus AGG.
| Period | Attribution Window | Model Return | AGG Reference Return | Excess Return vs. AGG | Excess Return vs. AGG |
| 1D | Jul. 7 – Jul. 8 | -0.17% | -0.17% | +0.00 percentage points | +0 bps |
| 1W | Jun. 30 – Jul. 8 | -0.03% | -0.62% | +0.59 percentage points | +59 bps |
| 1M | Jun. 5 – Jul. 8 | +0.36% | +0.20% | +0.15 percentage points | +15 bps |
| 3M | Apr. 7 – Jul. 8 | +1.29% | -0.14% | +1.43 percentage points | +143 bps |
| 6M | Jan. 5 – Jul. 8 | +2.41% | -0.04% | +2.45 percentage points | +245 bps |
| YTD | Dec. 31 – Jul. 8 | +2.78% | +0.12% | +2.66 percentage points | +266 bps |
Attribution Takeaways
The model’s YTD excess return of approximately +266 basis points has been driven primarily by positive contribution from SCHD, along with support from SGOV, HYG, EMB, and TIP.
The SCHD contribution is large, but it is explainable. SCHD’s YTD contribution reflects the model’s average exposure to the ETF during the year and SCHD’s strong standalone return in the model data. It should be described as portfolio contribution, not as a direct active return versus AGG.
Credit exposure also helped. HYG added approximately +23 bps YTD, while EMB added about +13 bps. This supports the model’s current Risk-on credit regime and confirms that spread-sensitive income has been more productive than broad bond-market beta.
Cash-like exposure also contributed. SGOV added approximately +24 bps YTD, reinforcing the value of short-term income while long-duration bonds have struggled for confirmation.
The biggest drag was TLT, which detracted about -8 bps YTD and was negative across most major windows. That supports the model’s current underweight to long-duration Treasuries.
The model’s relative edge versus AGG reflects both allocation and avoidance. The model benefited from what it owned — SCHD, SGOV, HYG, and EMB — but it also benefited from carrying less broad bond-market duration than AGG during a period when long-rate exposure remained difficult.
Methodology
- Trailing windows are measured through July 8, 2026.
- 1W = 5 trading days, 1M = 21 trading days, 3M = 63 trading days, and 6M = 126 trading days.
- YTD is measured from the Dec. 31, 2025 close through July 8, 2026.
- ETF contribution is calculated using each ETF’s daily beginning model weight multiplied by its daily return.
- The security-level table shows contribution to total model return, not security-level excess return versus AGG.
- AGG is used as the reference return for the model-level comparison. Model excess return equals the model return minus the AGG return.
- Contribution totals may differ slightly from compounded model returns because the table sums daily return contributions in basis points, while model returns are compounded over the full period.
- Source: ETFFixedIncome.com Income 10-Spot Model workbook, Backtest_v8, Data_Clean_v8, Rolling_Returns_v8, and Strategy_v8 tabs.
Sources
- ETFFixedIncome.com Income 10-Spot Model / ETFFI Core Aggressive Model Working Copy, Dashboard_v8, Strategy_v8, Backtest_v8, Rolling_Returns_v8, and Data_Clean_v8 tabs; latest model signal date July 8, 2026.
- Federal Reserve, June 17, 2026 FOMC statement.
- FRED, Market Yield on U.S. Treasury Securities at 10-Year Constant Maturity.
- FRED, ICE BofA U.S. High Yield Index Option-Adjusted Spread.
Disclaimer: This report is for informational and educational purposes only and should not be considered investment advice or a recommendation to buy or sell any security. Model outputs, returns, signals, and attribution can change as market data updates. Past performance does not guarantee future results.