
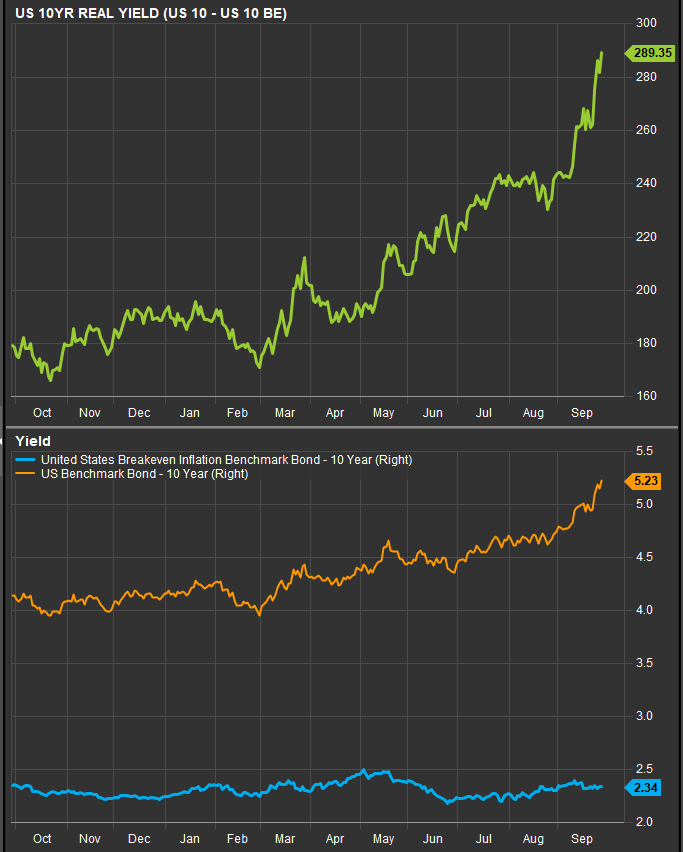
Oil remains above $105 Brent, the Fed is still leaning toward further tightening, and credit spreads are finally widening—raising income opportunities but keeping duration volatility elevated.
The Lead
The Treasury selloff extended Monday, pushing yields to another round of multi-year highs. The 10-year closed at 5.234%, up 7.4 bps, while the 2-year rose 7.7 bps to 4.924% and the 30-year climbed 6.3 bps to 5.552%. Most importantly, the 10-year real yield reached 2.90%, a new one-year high and nearly 30 bps above its level one week ago.
The pressure remains intact this morning. The 10-year Treasury is hovering around 5.27%, near a 19-year high, as global bond markets adjust to the prospect that policy rates may settle substantially above their pre-pandemic norms. Markets now assign roughly a 72% probability of another Fed hike in October.
Energy remains part of that equation. Brent is holding around $105 per barrel and WTI near $92, with improved Saudi and Gulf export volumes offset by continued uncertainty surrounding the U.S.-Iran conflict. Saudi Arabia has restarted loadings from Yanbu, but alternative export routes remain less efficient than normal Gulf shipping, helping keep the geopolitical premium in crude.
Fed Governor Lisa Cook added to the hawkish tone Monday, arguing that strong AI-related investment demand and elevated oil prices could keep inflation pressure persistent while the labor market remains resilient enough to tolerate additional tightening.
The preferred posture remains an income-oriented allocation—collecting yield from lower-volatility bond segments rather than relying on a sharp decline in Treasury rates to drive total return. At current levels, Treasury valuation is increasingly compelling, but extreme real yields and elevated MOVE argue for building duration gradually rather than trying to identify the precise peak in yields.
Rates Tape
| Market | Latest | 1D Change | 1W Change |
| 2Y Treasury | 4.924% | +7.7 bps | +17.7 bps |
| 10Y Treasury | 5.234% | +7.4 bps | +28.3 bps |
| 30Y Treasury | 5.552% | +6.3 bps | +26.6 bps |
| 2s10s Curve | +30.9 bps | -0.3 bp | +10.6 bps |
| 5s30s Curve | +48.6 bps | -2.0 bps | +2.6 bps |
Duration ETFs took another hit Monday. TLT fell 0.88%, IEF lost 0.52%, VGLT declined 0.80%, EDV fell 1.13% and ZROZ dropped 1.92%. Over one week, TLT is down 3.83%, while EDV and ZROZ have fallen 5.83% and 6.46%, respectively.
Flows, however, are beginning to show substantial dip-buying. TLT attracted $872 million Monday and $1.09 billion over one week despite the price decline. That is a meaningful shift: investors are increasingly willing to add long Treasury duration as benchmark yields move above 5.2%, even though intermediate-duration IEF still recorded roughly $273 million of weekly outflows.
Macro Signal Board
| Signal | Latest | 1D | 1W | 1Y Pctl. | Trading Read |
| 10Y Treasury | 5.234% | +7.4 bps | +28.3 bps | 100th | Historically attractive yield, trend still hostile |
| 30Y Treasury | 5.552% | +6.3 bps | +26.6 bps | 100th | Long-end pressure remains intense |
| 10Y Real Yield | 2.90% | +7 bps | +28 bps | 100th | Exceptional real income |
| 10Y Breakeven | 2.34% | Flat | Flat | 70th | Selloff remains real-rate driven |
| Fed Funds Implied Rate | 3.90% | +0.5 bp | Flat | 92nd | Further tightening remains priced |
| IG OAS | 83 bps | +2 bps | +6 bps | 86th | Credit compensation improving |
| HY OAS | 302 bps | +9 bps | +36 bps | 82nd | Credit finally repricing materially |
| MOVE | 101.8 | +5.8 | +20.6 | 98th | Extreme Treasury volatility |
| WTI Crude | $92.60 | +$0.19 | -$3.18 | 76th | WTI contained; Brent remains elevated |
The critical development is that the selloff remains overwhelmingly a real-yield story. The 10-year nominal yield has risen more than 28 bps in one week while the 10-year breakeven has not moved. That suggests markets are repricing the real policy rate, growth resilience and equilibrium interest-rate assumptions rather than simply losing confidence in inflation expectations.
Credit is finally adjusting as well. HY OAS has widened from 266 bps to 302 bps in one week, while IG OAS has moved to 83 bps. That improves credit valuation, although the largest opportunity still sits in government yields, where investors can now capture nearly 3% real income without taking corporate default risk.
Calendar Watch
Monday’s Dallas Fed survey reinforced the broader picture of resilient activity alongside elevated price pressure. The headline general business activity index eased to 9.8 from 11.6, but the underlying manufacturing data were considerably stronger: production jumped to 29.5 from 16.1, new orders rose to 30.7 from 22.0, shipments increased to 24.8 and employment climbed to 15.1. At the same time, the raw-material prices index rose to 52.2 from 44.1.
That mix—stronger output and orders alongside faster input-price growth—is exactly the type of combination keeping the Fed cautious.
Today’s calendar focuses on labor-market demand and consumer confidence:
| Time | Release | Consensus | Prior |
| 9:00 a.m. | Case-Shiller 20-City Home Prices M/M | +0.10% | +0.24% |
| 9:00 a.m. | Case-Shiller 20-City Home Prices Y/Y | +2.2% | +2.1% |
| 10:00 a.m. | Consumer Confidence | 90.0 | 89.4 |
| 10:00 a.m. | JOLTS Job Openings | 7.205M | 7.271M |
JOLTS is the key fixed income release. The market is entering the print with the Fed describing labor conditions as resilient and roughly 72% odds of an October hike. A large decline in openings could challenge that narrative; continued strength would reinforce the argument that tighter policy can persist.
Fed communication is also heavy, with Governors Michelle Bowman, Michael Barr and Christopher Waller plus regional Fed presidents Austan Goolsbee, Alberto Musalem and John Williams scheduled to speak. Tomorrow brings the August PCE report, followed by September payrolls Friday, making today’s session the beginning of an important three-day macro sequence.
ETF Flow Leaders
| ETF | Segment | 1W Return | 1W Flows | 1M Flows |
| IUSB | Broad Market | -1.67% | +$4.44B | +$5.28B |
| HYG | High Yield | -1.44% | +$1.14B | +$36M |
| TLT | Long Treasury | -3.83% | +$1.09B | +$1.60B |
| SGOV | Ultrashort Treasury | +0.06% | +$936M | +$6.45B |
| VTEB | Municipal Bonds | -2.10% | +$867M | +$2.56B |
| MUB | Municipal Bonds | -2.08% | +$818M | +$2.16B |
| BND | Broad Market | -1.58% | +$445M | +$2.48B |
| AGG | Broad Market | -1.66% | +$410M | +$1.45B |
The strongest signal remains broad-market bond accumulation. IUSB has attracted $4.44 billion over one week and $5.28 billion over one month, while BND and AGG also continue to draw capital despite substantial negative returns. Investors are increasingly responding to higher yields rather than waiting for positive price momentum.
The second shift is the return of long-duration buying. TLT took in $872 million Monday alone, bringing weekly flows to +$1.09 billion, even though the ETF has lost nearly 4% over the same period. VGLT also attracted roughly $292 million. The flow data suggest 5%-plus Treasury yields are beginning to clear the market.
Munis remain another consistent source of demand. VTEB and MUB combined attracted nearly $1.7 billion over one week and more than $4.7 billion over one month.
Credit is more differentiated. HYG has attracted $1.14 billion over the week as spreads widened above 300 bps. Conversely, LQD remains -$193 million over the week and -$4.56 billion over one month, while VCIT lost $272 million. Investors appear more comfortable taking shorter-duration or high-yield credit exposure than combining tight investment-grade spreads with long duration.
Trading Implications
- Core bonds: Continue selectively adding IUSB, BND and AGG. Starting yields have repriced substantially and persistent inflows indicate institutional buyers are increasingly willing to absorb the selloff.
- Duration: TLT inflows are now confirming that 5.2%-plus Treasury yields are attracting buyers. The 2.90% real yield is historically compelling, but MOVE above 100 means exposure should still be scaled rather than established all at once.
- Credit: Spreads are finally providing more compensation. Favor short/intermediate investment grade over LQD-style long spread duration while volatility remains elevated.
- High yield: The move to a 302 bp HY OAS, combined with $1.14B of weekly HYG inflows, is materially more constructive than the sub-270 bp spread environment earlier this month. Maintain quality discipline, but the valuation argument is improving.
- Cash management: SGOV and USFR remain attractive. Another potential Fed hike means ultrashort yields continue to provide substantial income plus the flexibility to extend duration later.
- Munis: VTEB/MUB flows remain one of the strongest allocation signals in fixed income. Higher tax-exempt yields justify adding exposure, with short and intermediate maturities still preferable to maximum duration.
- TIPS / inflation hedges: A 2.90% real 10-year yield is exceptionally attractive in absolute terms, but long-duration TIPS retain significant rate sensitivity. VTIP remains the cleaner inflation hedge while oil and Middle East risk stay elevated.
- CLOs / loans: JAAA continues to show resilient demand, with roughly $225M of weekly and $1.11B of one-month inflows. AAA floating-rate credit remains a useful way to collect income while avoiding conventional duration.
Bottom Line
Fixed income is entering a more interesting valuation zone, but not a calmer one. The 10-year is near 5.27%, the 10-year real yield has reached 2.90%, HY spreads have widened above 300 bps and MOVE remains above 100. Those levels are drawing buyers back into core bonds and even TLT, but oil around $105 Brent and a roughly 72% probability of another October Fed hike argue against assuming the yield peak is already in. Favor high-quality income, diversified core bonds, munis and senior floating-rate credit, while continuing to build long-duration exposure incrementally.
Sources
- FactSet Research Systems Inc., ETFFixedIncome.com Fund Universe Return & Flow Database, September 29, 2026.
- FactSet Research Systems Inc., September 29, 2026 rates, credit, volatility, commodity, FX and economic-calendar data; latest closing readings through September 28.
- Federal Reserve Bank of Dallas, September 2026 Texas Manufacturing Outlook Survey.
- Reuters, September 29, 2026, global bond markets, Treasury yields and Federal Reserve expectations.
- Reuters, September 29, 2026, crude-oil markets and Middle East supply developments.
- Reuters, September 28–29, 2026, Federal Reserve Governor Lisa Cook and monetary-policy outlook.
Disclaimer: This commentary is for informational and educational purposes only and should not be considered investment advice. ETF return and flow data can change quickly and may reflect short-term trading activity rather than durable allocation trends. Fixed income investments are subject to interest-rate risk, credit risk, liquidity risk, inflation risk, tax considerations, and potential loss of principal.
