
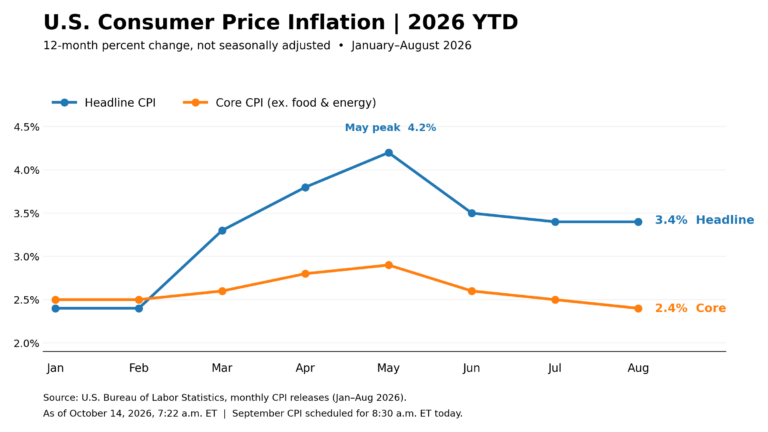
Treasuries rallied Tuesday and quality-oriented ETF flows strengthened, but WTI crude near $95 means headline inflation should jump; the critical duration signal is whether core CPI stays near 0.2%.
The Lead
Treasuries entered CPI day on firmer footing. Relative to Friday’s pre-holiday close, the 2-year yield rose 0.7 bp to 4.794%, but the 10-year fell 2.4 bps to 5.218% and the 30-year declined 3.2 bps to 5.566%. The 10-year real yield fell to 2.88%, while the curve flattened as long-end yields outperformed.
The rally is extending modestly this morning: the 10-year is near 5.20% and the 30-year around 5.58% ahead of the 8:30 a.m. CPI release. Markets assign only about a 20% probability of an October Fed hike, although another increase by December is almost fully priced.
The counterweight is energy. WTI crude closed Tuesday at $94.14 and is around $94.7 this morning, after briefly trading above $95 as renewed attacks on shipping and Saudi infrastructure raised concern about Middle East supply. That makes today’s inflation report unusual: a sharp increase in headline CPI is already expected, so the more important rates signal should come from core inflation and the breadth of price pressure beyond energy.
Preferred positioning remains an income-oriented allocation—collecting yield from lower-volatility bond segments rather than relying on a sharp decline in Treasury rates to drive total return. The duration signal is improving, but CPI remains the confirmation point.
Rates Tape
| Market | Latest | 1D* | 1W |
| 2Y Treasury | 4.794% | +0.7 bp | -0.5 bp |
| 10Y Treasury | 5.218% | -2.4 bps | -6.3 bps |
| 30Y Treasury | 5.566% | -3.2 bps | -8.6 bps |
| 2s10s Curve | +42.4 bps | -3.1 bps | -5.8 bps |
| 5s30s Curve | +55.9 bps | -2.1 bps | -5.8 bps |
Because the Treasury market was closed Monday, 1D Treasury changes compare October 13 with the previous valid cash-market close on October 9.
Duration ETFs responded strongly Tuesday. TLT gained 0.41%, IEF +0.12%, VGLT +0.36%, EDV +0.61% and ZROZ +0.91%. Weekly performance is now positive across the group, led by ZROZ +3.15%, EDV +2.71% and TLT +1.59%.
The tactical improvement is real: long yields have fallen even with crude rising. The remaining test is whether today’s CPI allows the 10-year to hold around or below 5.20%.
Macro Signal Board
| Signal | Latest | 1D | 1W | 1Y Pctl. | Trading Read |
| 10Y Treasury | 5.218% | -2.4 bps | -6.3 bps | 96th | Duration improving |
| 30Y Treasury | 5.566% | -3.2 bps | -8.6 bps | 96th | Long-end pressure easing |
| 10Y Real Yield | 2.88% | -3 bps | -3 bps | 97th | Exceptional real income |
| 10Y Breakeven | 2.33% | Flat | -3 bps | 64th | Expectations remain contained |
| Fed Funds Implied Rate | 3.885% | +0.3 bp | Flat | 92nd | October pause favored |
| IG OAS | 83 bps | Flat | Flat | 85th | Quality credit preferred |
| HY OAS | 316 bps | +5 bps | +13 bps | 91st | Risk premium rebuilding |
| MOVE | 101.1 | +2.6 | -4.1 | 94th | Still elevated |
| WTI Crude | $94.14 | +$0.40 | +$4.70 | 79th | Inflation risk elevated |
The most constructive signal is that real yields have fallen while breakevens remain contained. The 10-year breakeven is still only 2.33%, even with WTI almost $5 higher over one week. That suggests the bond market continues to treat the energy shock primarily as a near-term headline inflation problem rather than an unanchoring of long-run inflation expectations.
Credit is less uniformly constructive. HY OAS widened 13 bps over the week to 316 bps, while IG OAS remained at 83 bps. That divergence fits the ETF flow data: investors are adding quality credit while reducing high-yield exposure.
Calendar Watch
Tuesday’s data did not materially weaken the soft-landing narrative. The NFIB Small Business Optimism Index slipped to 97.9 from 98.7, while ADP’s weekly employment estimate showed private employers adding an average 24,750 jobs per week over the four weeks through September 26. ADP said hiring slowed after five consecutive weeks of improvement.
Housing was firmer than expected. Existing-home sales increased 1.5% to a 3.99 million annual rate, above the 3.95 million consensus in the data pack. Inventory increased to 1.60 million units, although sales remained 2.2% below year-ago levels.
Today’s CPI report is the week’s key fixed-income event:
| Time | Release | Consensus | Prior |
| 8:30 a.m. | Headline CPI M/M | +0.60% | +0.40% |
| 8:30 a.m. | Headline CPI Y/Y | 3.6% | 3.4% |
| 8:30 a.m. | Core CPI M/M | +0.20% | +0.30% |
| 8:30 a.m. | Core CPI Y/Y | 2.5% | 2.4% |
| 2:00 p.m. | Federal Reserve Beige Book | — | — |
BLS confirms the September CPI release is scheduled for 8:30 a.m. ET today. The FactSet consensus expects headline CPI to accelerate sharply because of energy, while Reuters’ economist survey also centers on +0.6% M/M headline inflation and +0.2% core.
For Treasuries, core CPI is the cleaner decision point. A 0.2% or softer core print would reinforce the recent duration rally even if headline inflation reaches 0.6%. A 0.3%+ core print—particularly with firm shelter or services inflation—would make a December hike easier to justify and could put the 10-year back toward 5.30%.
The Fed’s Beige Book is due at 2:00 p.m. and should provide additional evidence on whether higher energy costs and elevated borrowing rates are starting to weaken activity or broaden price pressures.
ETF Flow Leaders
| ETF | Segment | 1W Return | 1W Flows | 1M Flows |
| VTEB | Municipal Bonds | +1.25% | +$1.69B | +$6.44B |
| MUB | Municipal Bonds | +1.24% | +$1.54B | +$5.97B |
| SGOV | Ultrashort Treasury | +0.05% | +$1.29B | +$6.00B |
| LQD | Investment Grade | +0.71% | +$1.21B | +$1.50B |
| AGG | Broad Market | +0.42% | +$736M | +$2.19B |
| TLT | Long Treasury | +1.59% | +$634M | +$2.82B |
| TLH | Long Treasury | +1.21% | +$577M | +$743M |
| BND | Broad Market | +0.47% | +$511M | +$2.79B |
The flow tape is strongly quality-oriented. Municipal bonds have moved back to the top: VTEB and MUB attracted a combined $3.22 billion over one week, while both also produced gains above 1%. That is a healthier signal than flows alone because investors are being rewarded rather than merely averaging into falling prices.
Investment grade is another standout. LQD attracted $1.21 billion over the week and $1.50 billion over one month, while AGG and BND also maintained positive core-bond flows.
Duration buying continues as well. TLT and TLH attracted roughly $1.21 billion combined, alongside strong weekly returns. Investors are increasingly treating 5%-plus Treasury yields as an opportunity rather than simply a source of mark-to-market risk.
High yield is the notable exception. HYG lost approximately $570 million over the week while returning -0.12%, even as HY spreads widened to 316 bps. The shift toward investment grade and away from high yield is one of the clearer risk-management signals in today’s flow data.
Trading Implications
- Core bonds: Continue adding BND and AGG. The signal is strengthening as yields remain high, weekly returns improve and inflows persist.
- Duration: The move is becoming more constructive, but CPI is the confirmation point. Core CPI at 0.2% or lower plus a 10-year holding below roughly 5.20% would strengthen the case for extending duration further. A 0.3%+ core print and a reversal above 5.30% would argue for maintaining only partial exposure.
- Credit: Favor investment grade over high yield. LQD flows are strong, while HY spreads have widened and HYG is seeing redemptions. High absolute yields allow investors to earn meaningful income without reaching aggressively for credit risk.
- High yield: Remain selective. A 316 bp HY OAS is better compensation than September offered, but the combination of spread widening and ETF outflows means the signal has not yet turned decisively positive.
- Cash management: SGOV remains a major destination with $1.29B of weekly and $6.00B of monthly inflows. Keep meaningful liquidity while CPI and the December Fed path remain unresolved.
- Munis: VTEB and MUB are currently the strongest flow-and-performance combination in the universe. Continue adding tax-exempt exposure, particularly where intermediate maturity offers attractive income without maximum long-end volatility.
- TIPS / inflation hedges: A 2.88% real 10-year yield remains compelling, and crude near $95 preserves the case for inflation protection. VTIP remains preferable for investors wanting inflation exposure without taking excessive duration risk.
- CLOs / loans: JAAA attracted roughly $326M over one week and $1.44B over one month. AAA floating-rate credit continues to fit the environment well: high-quality income with limited conventional duration.
Bottom Line
The bond market enters CPI with a better technical setup than it had one week ago. The 10-year has fallen to 5.22%, the 30-year to 5.57%, the real 10-year to 2.88%, and long-duration ETFs are finally producing positive weekly returns. Meanwhile, ETF flows are increasingly concentrated in munis, investment grade, core bonds and selective Treasury duration, while high yield is losing assets.
The remaining obstacle is crude. WTI is near $95 this morning, making a large headline CPI increase unsurprising. The more important question is whether core inflation remains near 0.2%. If it does, the duration signal should strengthen; if core inflation reaccelerates, the recent Treasury rally is vulnerable. Maintain a high-quality income bias and use today’s CPI as the next trigger for increasing—or pausing—duration exposure.
Sources
- FactSet Research Systems Inc., ETFFixedIncome.com Fund Universe Return & Flow Database, October 14, 2026.
- FactSet Research Systems Inc., October 14, 2026 rates, credit, volatility, commodity, FX and economic-calendar data; latest closing readings through October 13.
- U.S. Bureau of Labor Statistics, October 2026 release calendar and CPI schedule.
- ADP Research, NER Pulse preliminary employment estimate through September 26, 2026.
- National Association of Realtors, September 2026 Existing-Home Sales.
- Federal Reserve Board, October 14, 2026 Beige Book calendar.
- Reuters, October 14, 2026, U.S. Treasury market, CPI expectations and Fed pricing.
- Reuters, October 14, 2026, WTI crude and Middle East supply developments.
Disclaimer: This commentary is for informational and educational purposes only and should not be considered investment advice. ETF return and flow data can change quickly and may reflect short-term trading activity rather than durable allocation trends. Fixed income investments are subject to interest-rate risk, credit risk, liquidity risk, inflation risk, tax considerations, and potential loss of principal.
