The Lead
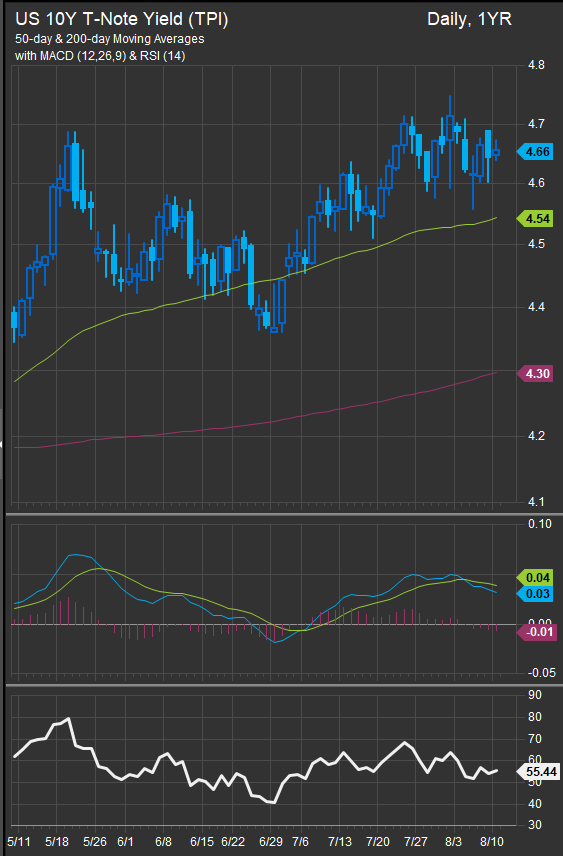
Fixed income starts Monday with a more constructive rates backdrop after Friday’s weak payroll report. The 2-year Treasury fell to 4.19%, the 10-year declined to 4.64%, and the 30-year eased to 5.20%. The move helped Treasuries and core bonds, but the long end remains the constraint: the 30-year Treasury is still above 5%, and the 10-year real yield remains elevated at 2.40%.
Friday’s labor report shifted the policy debate. July nonfarm payrolls fell 23K versus consensus for a gain, wage growth cooled, and Reuters reported Monday that weak payrolls and downward revisions reduced the market-implied probability of a September Fed hike to 44% from 67% the prior week. The same report noted the 10-year Treasury yield near 4.647% as markets looked ahead to this week’s CPI data.
The setup still favors an income-oriented allocation: collecting yield from ultrashort, floating-rate, short-duration, municipal, short-credit, AAA CLO, and selective high-yield segments while keeping long-duration Treasury exposure tactical.
Rates Tape
| Rate | Latest | 1D Change | 1W Change |
| 2Y Treasury | 4.19% | -5.0 bp | -7.5 bp |
| 10Y Treasury | 4.64% | -2.3 bp | -7.1 bp |
| 30Y Treasury | 5.20% | -1.5 bp | -5.8 bp |
| 2s10s Curve | 44.9 bp | +2.7 bp | +0.4 bp |
| 5s30s Curve | 84.7 bp | +2.2 bp | +1.8 bp |
The payroll miss helped duration, but the rally was still concentrated away from the longest maturities. TLT gained 0.69% over the past week, EDV gained 1.02%, ZROZ gained 1.03%, and VGLT gained 0.99%. Intermediate duration also improved, with VGIT up 0.45% and IEF up 0.38%.
Macro Signal Board
| Signal | Latest | 1D Change | 1W Change | 1Y Percentile | Trading Read |
| 10Y Treasury | 4.64% | -2.3 bp | -7.1 bp | 96th | Payrolls helped, but yields remain high. |
| 30Y Treasury | 5.20% | -1.5 bp | -5.8 bp | 98th | Long-end risk remains elevated above 5%. |
| 10Y Real Yield | 2.40% | -3.0 bp | -7.0 bp | 96th | Real yields still limit duration upside. |
| 10Y Breakeven | 2.25% | -1.0 bp | -3.0 bp | 20th | Inflation compensation remains contained. |
| Fed Funds Implied Rate | 3.63% | -0.3 bp | +0.3 bp | 13th | Front-end policy pricing remains relatively dovish. |
| IG OAS | 78 bp | 0 bp | -1 bp | 48th | IG credit stress remains contained. |
| HY OAS | 270 bp | -1 bp | -15 bp | 8th | HY spreads tightened and remain very tight. |
| MOVE Index | 72.0 | -4.1 | -11.0 | 46th | Rates volatility improved materially. |
| WTI Crude | $78.18 | +$0.89 | -$6.49 | 66th | Oil is off the highs but still a swing factor. |
The 30-day Fed funds futures proxy implies a monthly average policy-rate expectation near 3.63%. CME describes 30-day Fed funds futures as settling at 100 minus the arithmetic average effective federal funds rate for the contract month.
Calendar Watch
Friday’s data was bond-friendly. Nonfarm payrolls fell 23K versus +92.5K consensus, private payrolls rose only 30K versus +82.5K consensus, and hourly earnings rose 0.10% versus 0.30% consensus. The unemployment rate fell to 4.1%, but participation also slipped to 61.4%, limiting how much comfort investors should take from the lower jobless rate.
There are no major U.S. economic releases in the August 10 data. The key test is later this week:
| Date | Release | Consensus | Prior |
| Aug. 12 | CPI M/M | +0.10% | -0.40% |
| Aug. 12 | CPI Y/Y | +3.4% | +3.5% |
| Aug. 12 | Core CPI M/M | +0.20% | 0.00% |
| Aug. 12 | Core CPI Y/Y | +2.5% | +2.6% |
| Aug. 13 | PPI M/M | +0.10% | -0.30% |
| Aug. 13 | Core PPI M/M | +0.30% | +0.20% |
| Aug. 14 | Retail Sales M/M | +0.10% | +0.20% |
| Aug. 14 | Michigan Sentiment, prelim. | 54.8 | 55.2 |
The BLS calendar confirms the July CPI release is scheduled for Wednesday, August 12 at 8:30 a.m. ET. For bonds, CPI is the next hurdle: a benign print would support the post-payroll rally, while sticky inflation could quickly revive pressure on the 30-year Treasury and long-duration ETFs.
Oil also remains relevant. Reuters reported Monday that oil prices were slightly higher as investors watched geopolitical uncertainty around the Strait of Hormuz and ongoing Iran-Oman talks.
ETF Flow Leaders
| ETF | Segment | 1W Return | 1W Flows | 1M Flows |
| SGOV | Ultra-Short Treasuries | +0.06% | +$1.98B | +$4.85B |
| GLD | Diversified / Gold | +7.20% | +$1.44B | +$2.06B |
| BND | Broad Market Bonds | +0.35% | +$731M | +$2.73B |
| HYG | High Yield | +0.38% | +$722M | +$590M |
| JAAA | AAA CLOs | +0.10% | +$679M | +$937M |
| VTEB | Municipal Bonds | +0.59% | +$588M | +$1.10B |
| AGG | Broad Market Bonds | +0.35% | +$497M | +$577M |
| USFR | Floating-Rate Treasuries | +0.04% | +$398M | +$888M |
| SHY | Short Treasuries | +0.21% | +$376M | -$221M |
| MUB | Municipal Bonds | +0.46% | +$348M | +$591M |
The flow signal remains constructive and defensive. SGOV, USFR, SHY, ICSH, and JPST show continued demand for cash-management and short-duration exposure. BND and AGG confirm broad bond demand, while VTEB and MUB show strong municipal demand. JAAA continues to attract senior structured-credit flows.
The risk signal improved through HYG and JNK inflows, but high-yield spreads are already very tight, so the trade remains tactical rather than a broad risk-on all-clear. GLD inflows also stand out as a macro hedge signal rather than a fixed income allocation signal.
The caution remains long duration and long-duration credit. TLT saw $1.29B of weekly outflows despite positive weekly returns, while LQD lost $231M for the week and $1.40B over the past month.
Trading Implications
Core bonds: Maintain exposure. Broad bond ETFs are attracting assets, and lower yields after payrolls improve the near-term setup.
Duration: Favor intermediate duration over a full long-duration overweight. The payroll miss supports bonds, but the 30-year above 5%, elevated real yields, and TLT outflows keep long Treasuries tactical.
Credit: Prefer short and intermediate investment-grade exposure. VCSH and IGSB continue to attract assets, while LQD outflows show weaker demand for longer-duration credit.
High yield: Stay selective but less defensive. HYG and JNK flows improved, and spreads tightened, but valuations are not cheap.
Cash management: Keep ultrashort and floating-rate Treasury ETFs in the allocation mix. SGOV and USFR remain major flow leaders.
Munis: Maintain tax-aware municipal exposure. VTEB and MUB are both strong flow leaders, though duration should still be managed carefully.
TIPS / inflation hedges: Favor short-term inflation protection over broad long-duration TIPS. VTIP flows remain positive, and the sharp GLD inflow suggests investors still want inflation/geopolitical hedges into CPI week.
CLOs / loans: Senior floating-rate credit remains useful as a volatility buffer. JAAA flows remain constructive, while broader loan demand is more uneven.
Bottom Line
The August 10 setup is more constructive for fixed income after the payroll miss. Yields, real yields, breakevens, spreads, and rates volatility all eased from last week, while ETF flows support cash management, broad bonds, munis, AAA CLOs, high yield tactically, and inflation/geopolitical hedges. The main constraint is still the long end: the 30-year Treasury remains above 5%, real yields are elevated, and TLT flows are negative. Keep long Treasuries and longer-duration credit tactical into Wednesday’s CPI report.
Sources
- FactSet Research Systems Inc., ETFFixedIncome.com Fund Universe Return & Flow Database, August 10, 2026
- FactSet Research Systems Inc., August 10 rates, credit, volatility, commodity, FX, and economic calendar data
- Reuters reporting on payrolls, Treasury yields, Fed expectations, CPI expectations, oil, and Strait of Hormuz negotiations
- U.S. Bureau of Labor Statistics release calendar
- CME Group reference material on 30-day Fed funds futures methodology
Disclaimer: This commentary is for informational and educational purposes only and should not be considered investment advice. ETF return and flow data can change quickly and may reflect short-term trading activity rather than durable allocation trends. Fixed income investments are subject to interest-rate risk, credit risk, liquidity risk, inflation risk, tax considerations, and potential loss of principal.